2021 CFB Season Team Clusters
Contenders and Sickos. Which cluster is your team in?
We are around two and a half months away from the 2021 college football season. By now you have probably seen a couple previews detailing out the possible CFB Playoff contenders, sleepers etc. Today we will be doing our own numbers based preview with an algorithm we have used before, K-means clustering.
The TLDR version of explaining K-means clustering is essentially taking a lot of data and finding commonalities within it to form groups, or clusters. The algorithm does the heavy lifting assigning data points into the clusters, but it is up to us to observe and record any underlaying patterns we may discover. For data, we will be using stats from the 2019 and 2020 seasons, average recruiting rating over the past 4 cycles, team totals via Draftkings Sportsbook, and returning production from ESPN via Bill Connelly.
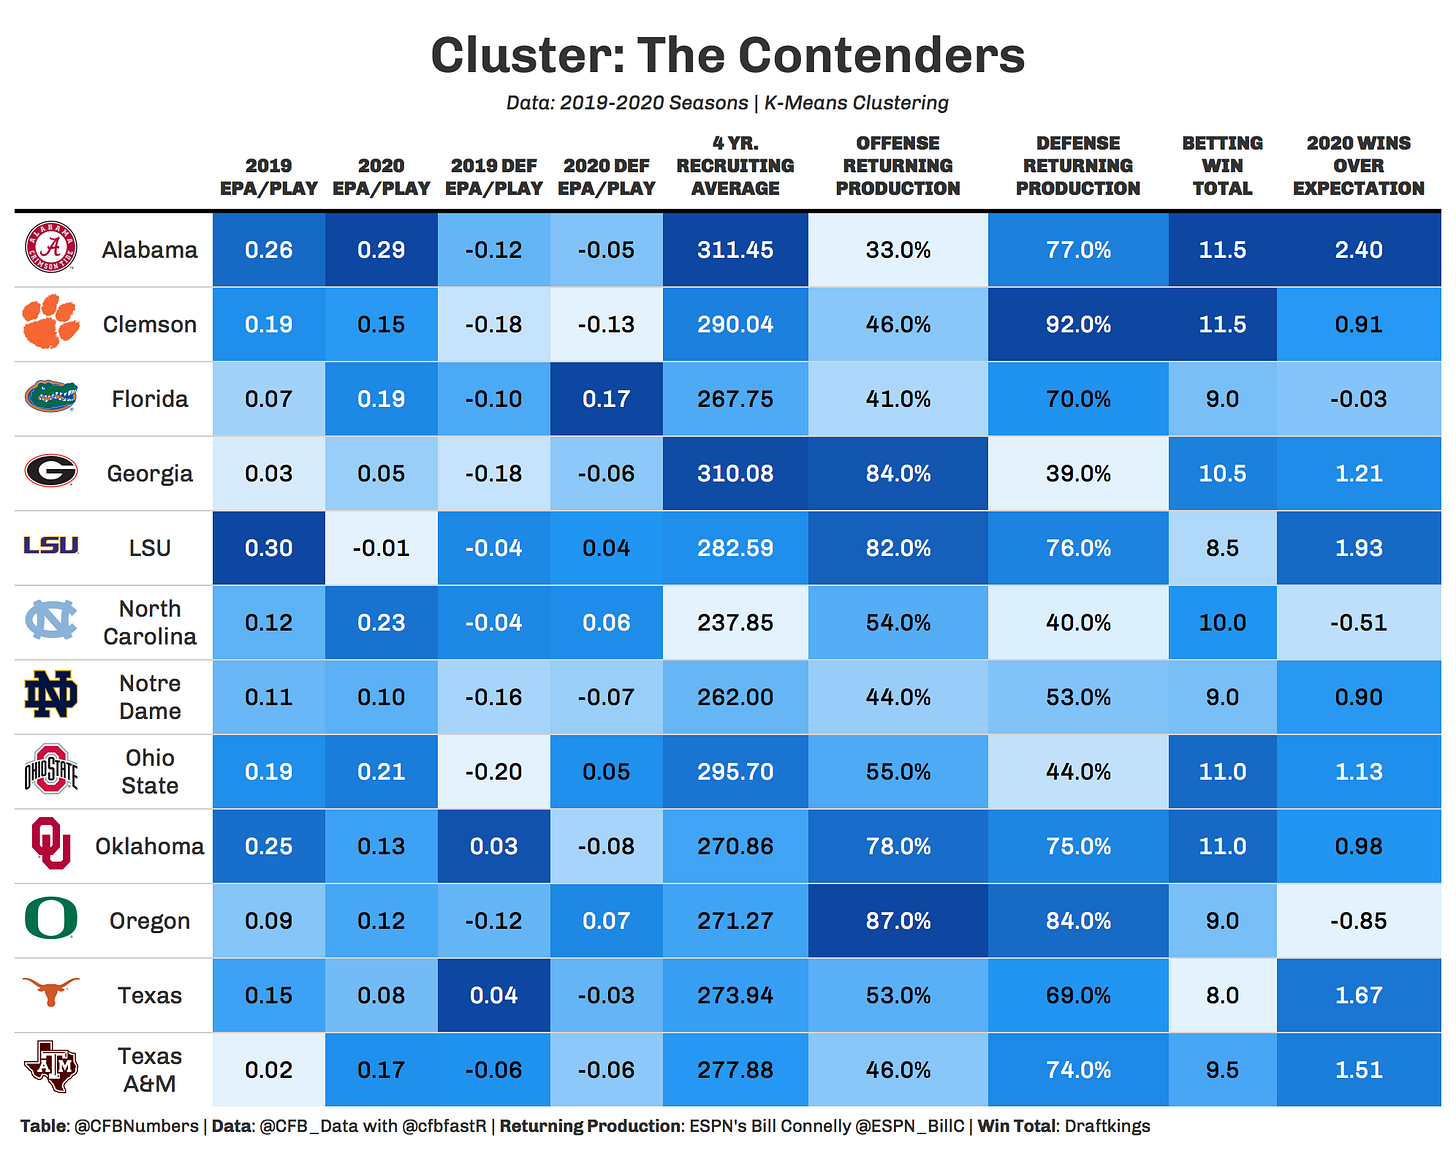
Behold: the 5 clusters of teams for the 2021 season. On the initial eye test we can see some things that make sense to us, math and data aside. Alabama, Clemson, and Ohio State in the same cluster, Rutgers and Kansas quite close to each other, it appears we can begin making sense of the groups and find some underlaying patterns. Lets start with the Alabama cluster aka “The CFP Contenders”.
*Note* I couldn’t include every stat used in one table, so stats like passing/rushing explosiveness were used but not included in this visual.
Overall in this cluster you would expect most of these teams to be in the playoff conversation come December. The majority of these teams boasted elite offenses in 2020. Two of the teams that didn’t (Georgia, LSU) return over 80% of their offensive production, meaning they should expect to improve into a potentially elite offense. This cluster recruits far and away better than any other cluster (their average class rating is 52 points higher than any other cluster). They’re almost projected to win almost 2 more games than any other cluster.
Where they fall short lies in returning production, which on average they’re in last in both offense and defensive returning production. Which can be surprising given some of these teams individual numbers (Clemson 92% on defense…. may god help the ACC). Overall if you had to bet on teams to make their conference championships or the playoffs, you would be sticking to these teams.
The next cluster is the next man up cluster. You’d expect some of these teams to compete for a seat in the conference championship, or at least hassle some of the contenders. Some of these teams will more than likely fill some of the remaining NY6 Bowl spots. Missouri might seem out of place but let me make a quick case for the Tigers. In just one pandemic stricken year Eli Drinkwitz improved the offense, and made QB Connor Bazelak an interesting prospect to watch. They also return 82% of the offense. Im not declaring them a SEC contender, but they may give Georgia and Florida a little trouble in the SEC East.
This cluster is strongest in returning production. They rank first in both offensive and defensive returning production. Their average win total is 7.9 which is second behind the contending cluster. Other than those metrics this cluster doesn’t have too many strengths, nor do they too many weaknesses. Auburn is the only true wildcard given their new coaching staff. Other than them expect these teams to give the contenders all they can handle.
Hang on to your belongings folks! This is where we get wild. The rollercoaster cluster has a little bit of everything, with teams ranging from 10 win possibilities to teams struggling to remain bowl eligible. This cluster excelled in the passing game, with QB’s such as BC’s Phil Jurkovec, USC’s Kedon Slovis, and Ole Miss Matt Corral appearing on NFL team’s radars.
The average win total is 6.66 wins, but as you can see that range goes from 9.5 to 3.5. The cluster is second to last in wins over expected, which is their actual wins minus their second order wins (the sum of their post game win probability). That coupled with a strong showing in returning production (2nd best among clusters), and you could see some of these teams playing football in January.
Im not sure I could ever call college football “boring” but it can hard to watch some of these teams play. This cluster is second worst offensively, but first in average defensive EPA/Play. These teams also struggle heavily getting players to play for them, as they rank last in average class recruiting rating. Their average win total is right at bowl eligibility at 6.08 wins. For this cluster to take the next step forward, their offense must help out some stellar defenses and put some points in the board.
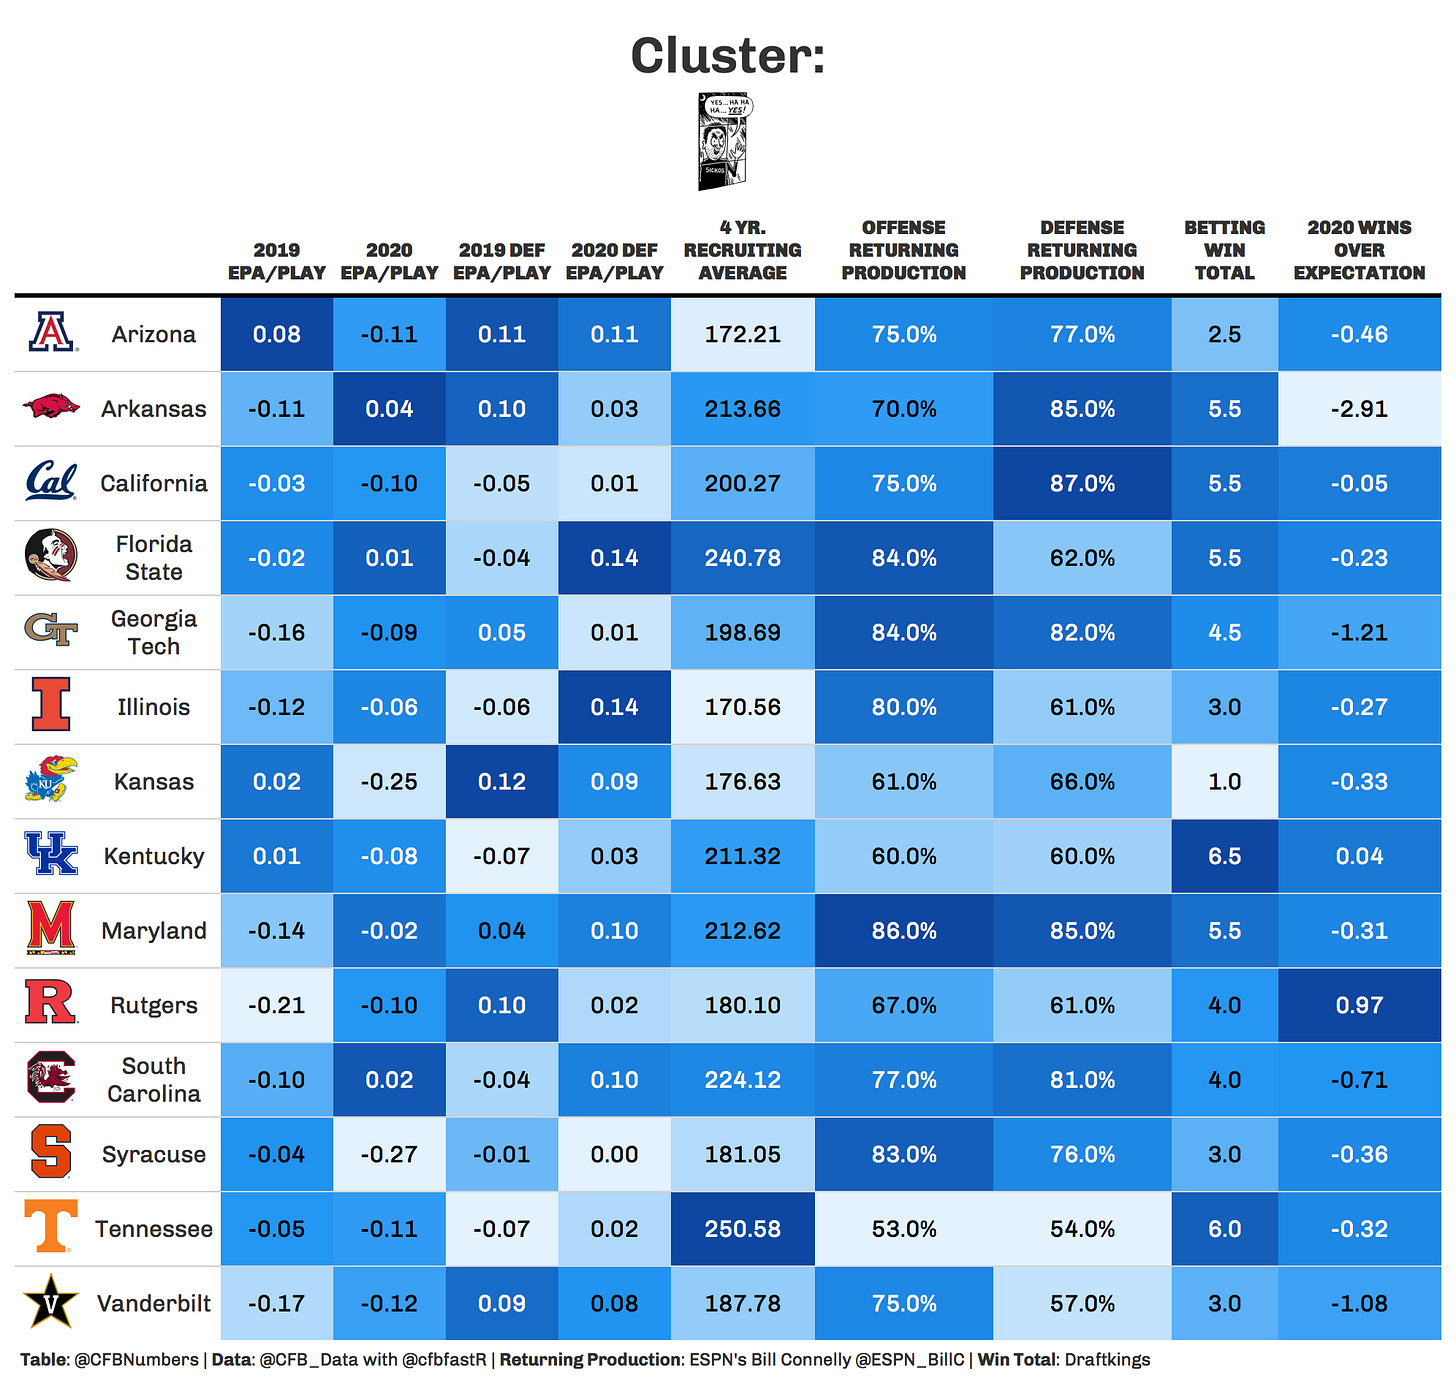
We have saved the best for last folks. May I present to you: the Sickos cluster. Some household names of this cluster include Kansas, Vanderbilt and Rutgers. Of course there is one name that sticks out like a sore thumb, my alma mater Florida State. The good news is they return 84% of their offensive production, and added a potential star QB in UCF transfer McKenzie Milton. That being said…. we need to see it happen on the field before we can remove them from the sickos pit.
This cluster as you probably expected ranked last in basically everything related to on the field play. From EPA/Play to explosiveness these teams have not put out a good product. The good news? This cluster ranks 3rd in returning production, and last in second order wins in 2020. With a little bit better luck in the variance department we could see some of these teams start to head in the right direction. Except Kansas they just renewed their sickos membership card.
Clustering is a great way to group data together to find underlaying patterns between points. For college football its a relatively simply way to see which teams have things in common and share common goals. It will be interesting to see how these clusters perform during the season, and once bowl games are decided, I will be reviewing how each cluster did this season.
If you want to dive in to the data like I do, check out @CFB_Data and @cfbfastR on Twitter, where you can learn how to get started in the world of College Football data analysis!
If you want to see more charts and one off analysis, follow my twitter page, @CFBNumbers


