College Football Analytics: Expected Passing Analysis
To pass or not to pass, that is the question.
We are steamrolling towards the end of the offseason and the beginning of the preseason for the 2021 CFB Season. Before we get into the season I wanted to look at one topic that has always been an interest of the analytics community: passing the ball. In recent years we have seen a bit of a “passing revolution” occur in the game of football both on the collegiate level and professional level. Teams are beginning to understand just how important QB’s are to a teams success. With that being said, this article will explore which teams can be considered “pass heavy” and which teams still stick to the run game.
To accomplish this we are going to need an expected drop back model. Luckily for us, the wonderful people over at Open Source Football have an article with code detailing how to build an expected drop back model (if you’re interested in coding, I HIGHLY recommend reading over some of that website). To summarize briefly, the model will look at things like down, distance, score differential etc. and assign a probability that a pass play will be called. Here is how the model performed:
An error rate of around 1% could be better, but for now we will deal with it. Considering the model only looks at game context and not opponent tendencies such as what defensive schemes they deploy, 1% is pretty good. The first question we are going to look at: How efficient are teams based on the odds of a play being a pass? Let’s look at the Expected Points Added (EPA/Play) based on a teams estimated drop back rate.
The dot size is a function of how many plays have occurred at that probability point. Plays tend to hover around that 50% probability mark, and we don’t often see very many instances where the odds of a pass are near 0% or near 100%. At the tail ends on each side you can see where things start to widen out as rushing becomes more efficient in higher pass situations and vice versa. When the odds are closer to even there isn’t much of a definitive edge but passing does see a little bit of an efficiency edge over rushing.
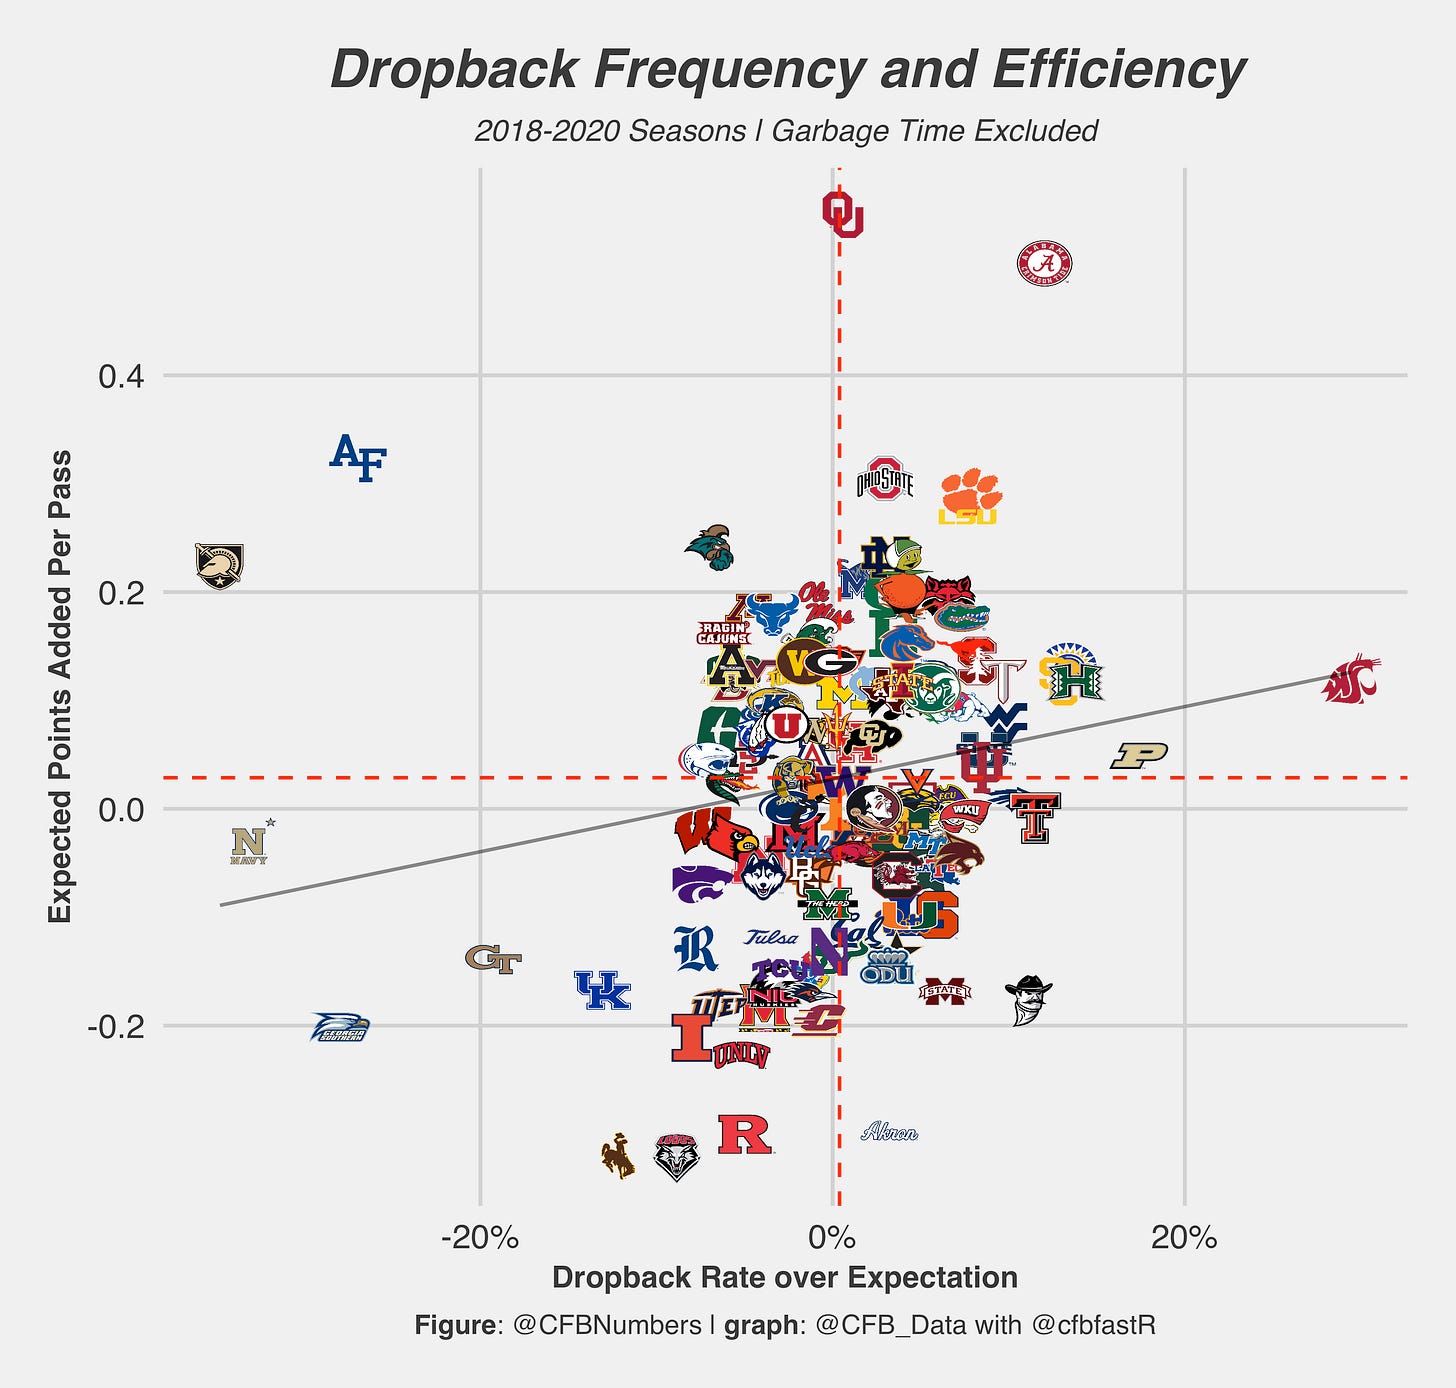
Over the past 3 seasons you can clearly see the effect the Mike Leach Air Raid has on Washington States numbers. Over the next three seasons I would expect Mississippi State to reach similar levels…. assuming Mike Leach survives three seasons in Starkville. Conversely you can see the service academies and Georgia Southern clearly enjoy their option run game. One thing you’ll notice is the powerhouse contenders (Alabama, Clemson, OSU etc.) sit more towards the left of the graph. This graph captures the raw numbers of a teams overall pass rate, but in order to get a better sense of a teams tendencies, we need to look at early down pass rate.
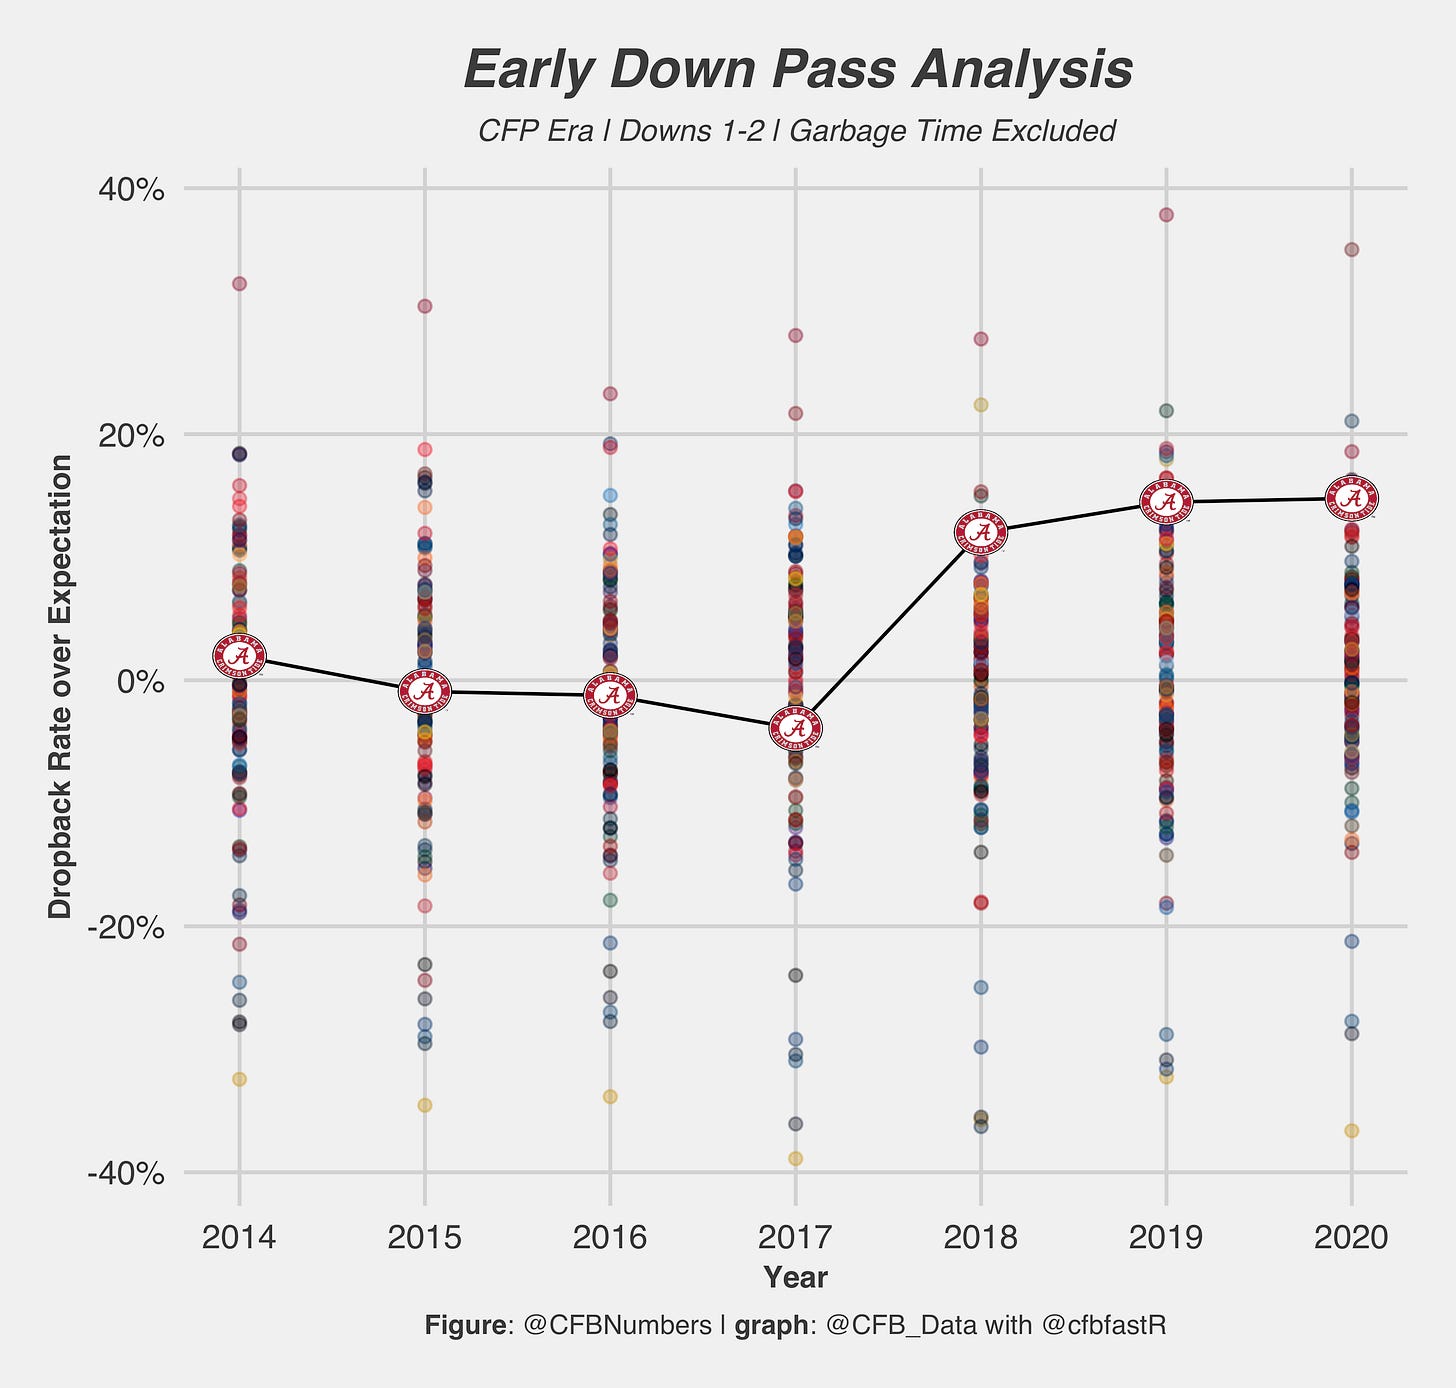
Looking at what a team does on first and second down while excluding garbage time gives us a neutral environment to evaluate their passing tendencies. Teams like Hawaii and Purdue start to separate themselves from the rest of the pack, while Alabama goes from just about an average raw drop back rate to well above average.
We’ve looked at tendencies, now which teams are efficient at passing the ball? Moving right on the graph will give you teams that pass more often than they would be expected to. As you up the graph you will find teams that are more efficient at passing the football (Army and Air Force throw very few passes, but when they do…. electricity!). One thing you’ll notice is every single playoff team during these seasons passes the ball more than they are expected to AND is efficient at passing the ball. The game in its modern stage boils down to the simple question: “Can you pass the ball, or not?”. A great example of the transformation of the passing game (and offense and general) comes from Alabama. A quote from the legendary coach:
"It used to be that good defense beats good offense. Good defense doesn't beat good offense anymore,"- Nick Saban
If someone like Nick Saban, known for his legendary defenses, can admit that it’s offense that rules the game, you know it’s a serious change. Alabama started to turn up the passing attack in 2018 with the breakout of Tua Tagovailoa, and they haven’t looked back. This dedication to the passing game allowed Mac Jones to turn in consistent 90+ percentile EPA/Play games, as they cruised to the national championship.
For Clemson it has been a little bit of a different story. They have maintained a positive DROE throughout the CFP Era, but 2020 they saw their highest rate with the help of 2021 NFL Draft Number 1 overall pick Trevor Lawerence.
In the early part of the CFP era Ohio State mostly stuck with the ground approach on the backs of RB’s like Ezekiel Elliot and Mike Webber (and some of J.K Dobbins). That changed with the arrival of Dwayne Haskins in 2018 and then Justin Fields in 2019. Ohio State has crept into positive territory and should continue building a vaunted passing attack with some of the best WR’s in the country.
Finally we will look at the last frequent CFP Playoff participant, Oklahoma. Surprisingly for Oklahoma they are all over the board when it comes to DROE. Given their run on Heisman QB’s, I would have expected them to be a consistent team in the positives. Nevertheless when they do pass the ball, the results are deadly, where they average over half of a point in EPA on early down passing.
Conclusion
Passing is here to stay in college football. If a legendary defensive coach like Nick Saban can admit it, you can as well. Some teams have begun to adopt more pass heavy tendencies, while others are still lagging behind. Also, just because you pass often does not mean you automatically succeed. Efficiency is just as important! This article was a bit long and there could have been more added but that will be for another day. I plan on looking at QB’s and how they perform under different passing probability levels. Hopefully we find something interesting!
If you want to dive in to the data like I do, check out @CFB_Data and @cfbfastR on Twitter, where you can learn how to get started in the world of College Football data analysis!
If you want to see more charts and one off analysis, follow my twitter page, @CFBNumbers
Thumbnail photo: Kevin C. Cox, Getty Images


