Examining Series Conversion Rate In College Football
"Thats another (Favorite Football Team)..... first down!"
There are a myriad of metrics designed to evaluate an offense in college football. This isn’t a problem, its merely just information presented in different ways in order to get as many angles as we can. Some metrics focus on a game level (yards per game, total EPA, etc.) while others are at a more granular per play basis (EPA/Play, QBR or PFF Grades for players). Today, we’re going to go somewhere in the middle and look at the per series level in the form of Series Conversion Rate.
Series Conversion Rate (SCR) is a metric used more commonly in the NFL analytics space. Essentially it answers this question: “How often do you take a series (1st-4th down), and turn it into another first down or a score?”. Using SCR, we can look at how a team does on a series by series basis and identify:
How the offenses play types relate to their series level efficiency.
How many plays they average per series, and the relationship that has with their efficiency
How efficient the offense is performing
Passing vs. Rushing
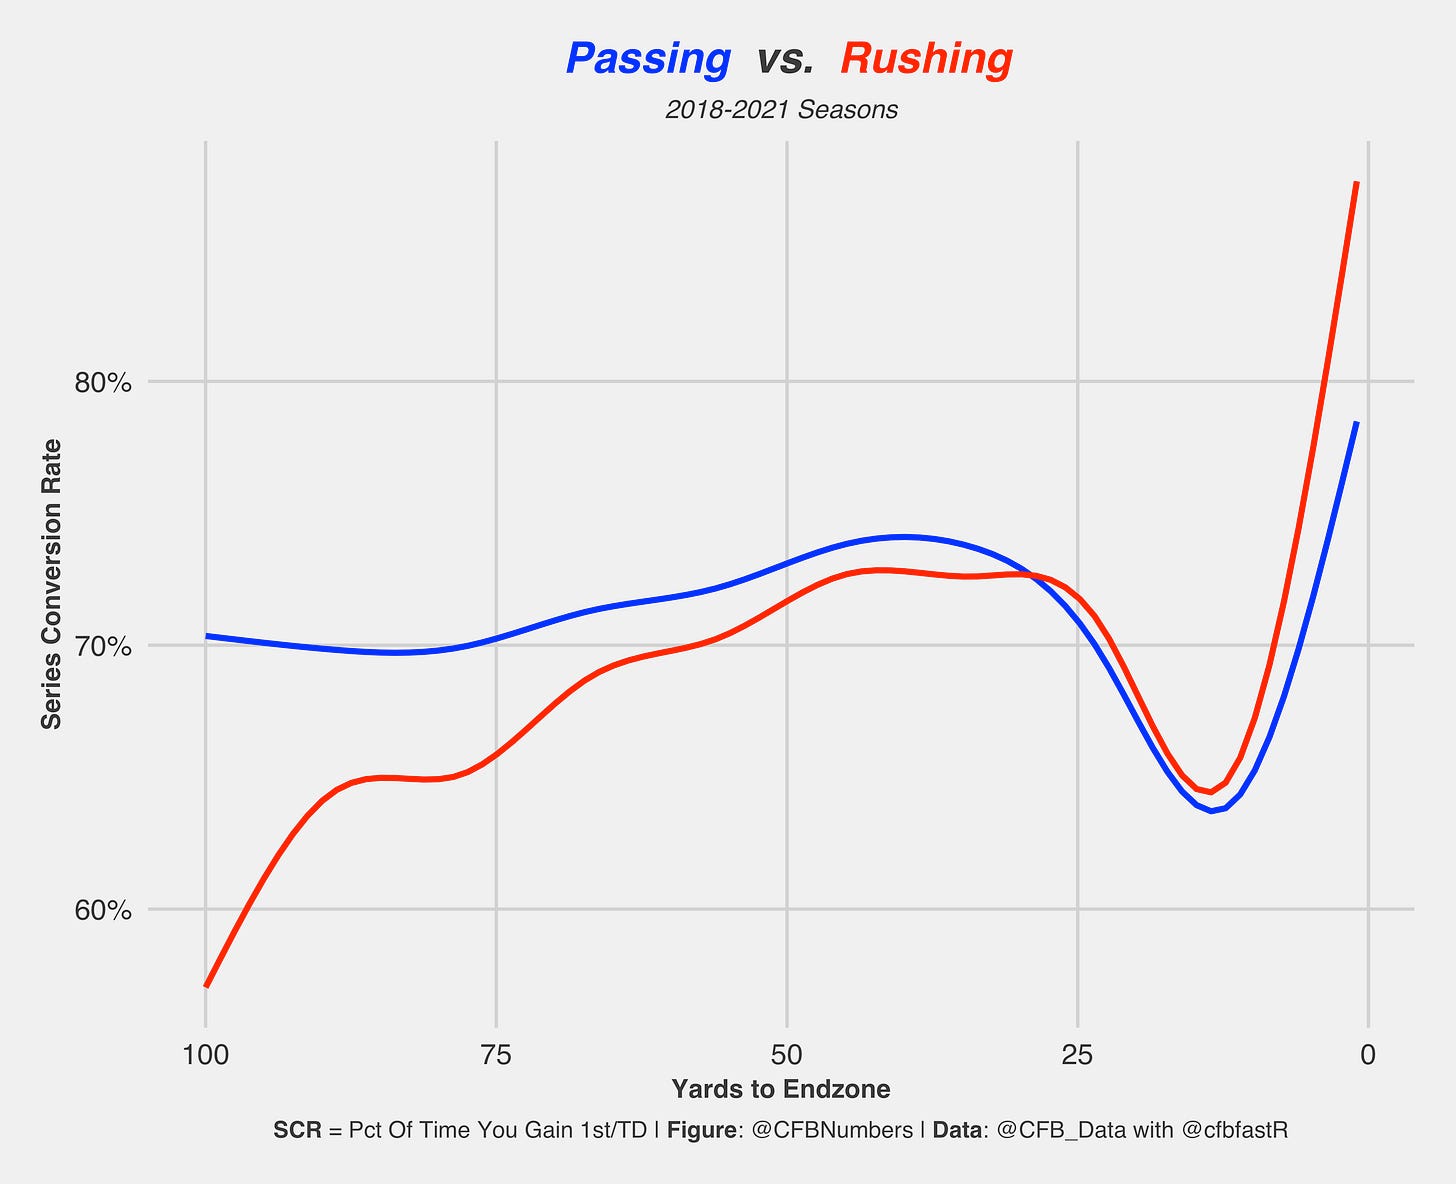
First, let’s look at how play types relate to series conversion. The lines represent whether a series started on a pass play (blue) or a running play (red). When teams are backed up in your own territory, they tend to convert a lot more series when they lead with passing plays vs. rushing plays. Once you get into your own territory, the pass first advantage is essentially gone. It should be noted that the smoothing error bands were omitted for the sake of the graphic, so it shouldn’t be seen as law. Still, this matches the conventional football analytics wisdom that passing > rushing in the early downs, until you get into a goal to go situation.
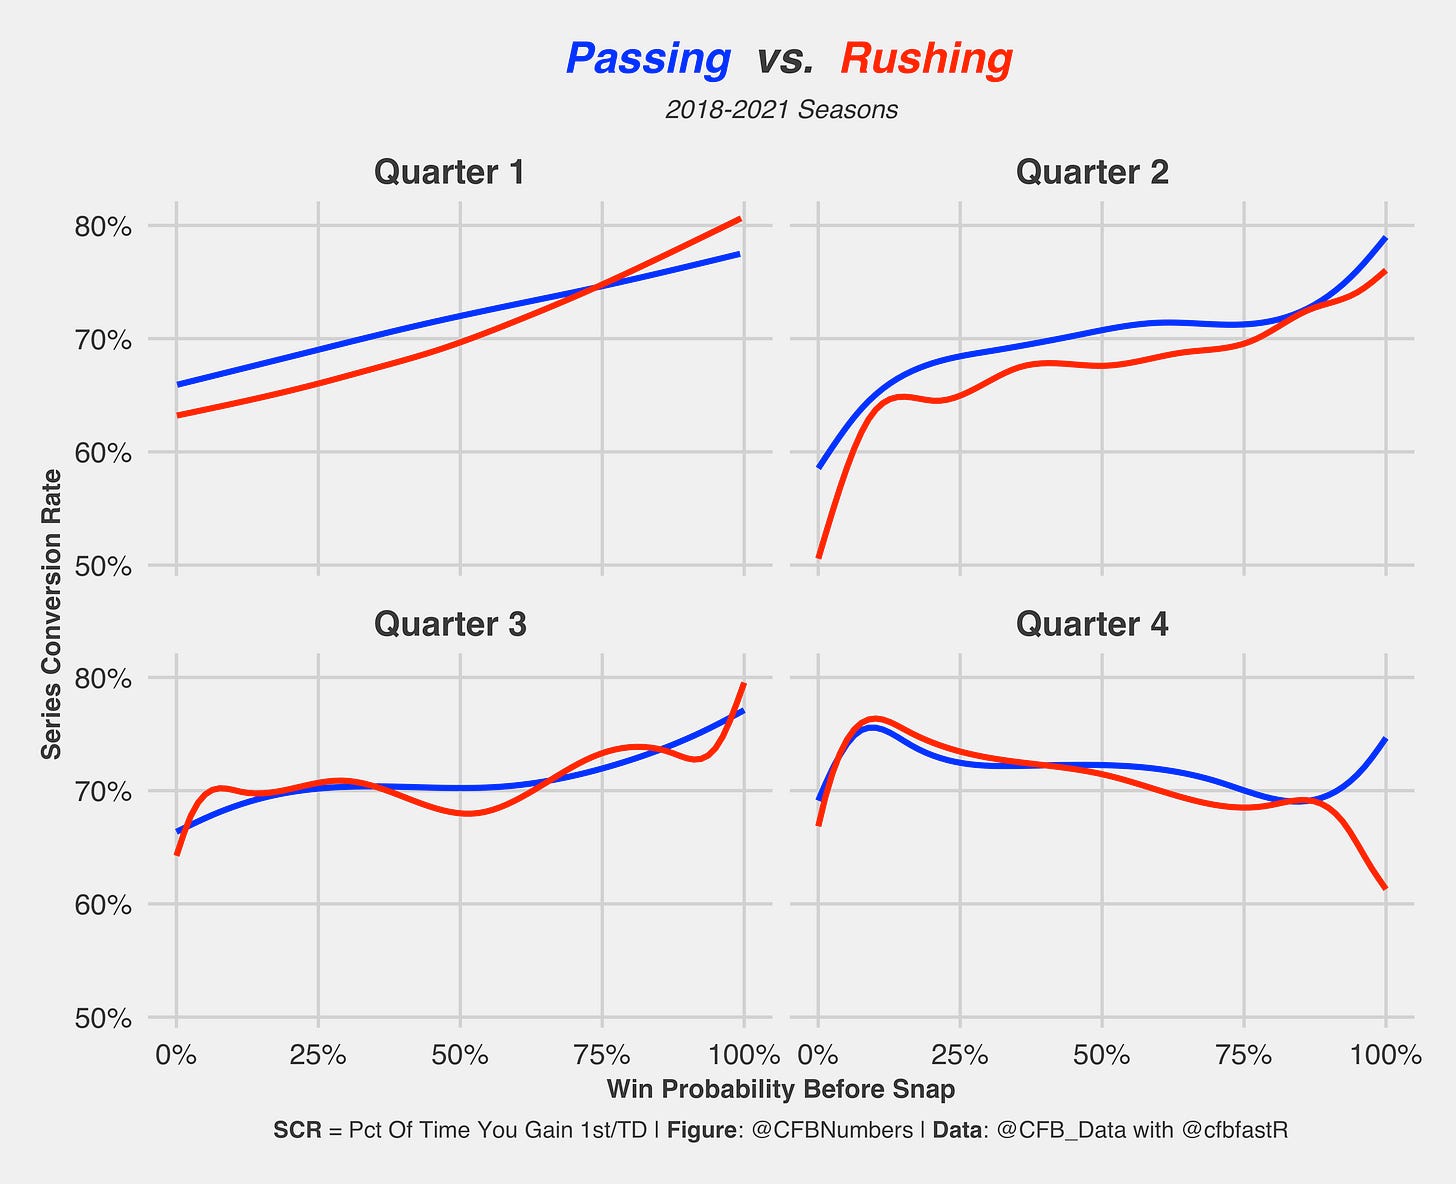
What about when the game is in hand vs. looking to comeback? We can look divide SCR rates by quarters to get a look into play types and win probability at different points in the game. In the first half if you already have a win probability higher than ~75%, pretty much either passing or running is going to work for you (Which, duh the game is already over). I did find it interesting that in the second half the series conversion rates are virtually the same for pass first and rush first regards of the win probability before the snap. You also start to see a bit of a downward trend in the 4th quarter, as teams with low odds to win start to get more riskier and take more shots to try and get back into the game.
2021 Series Conversion Rate By Team
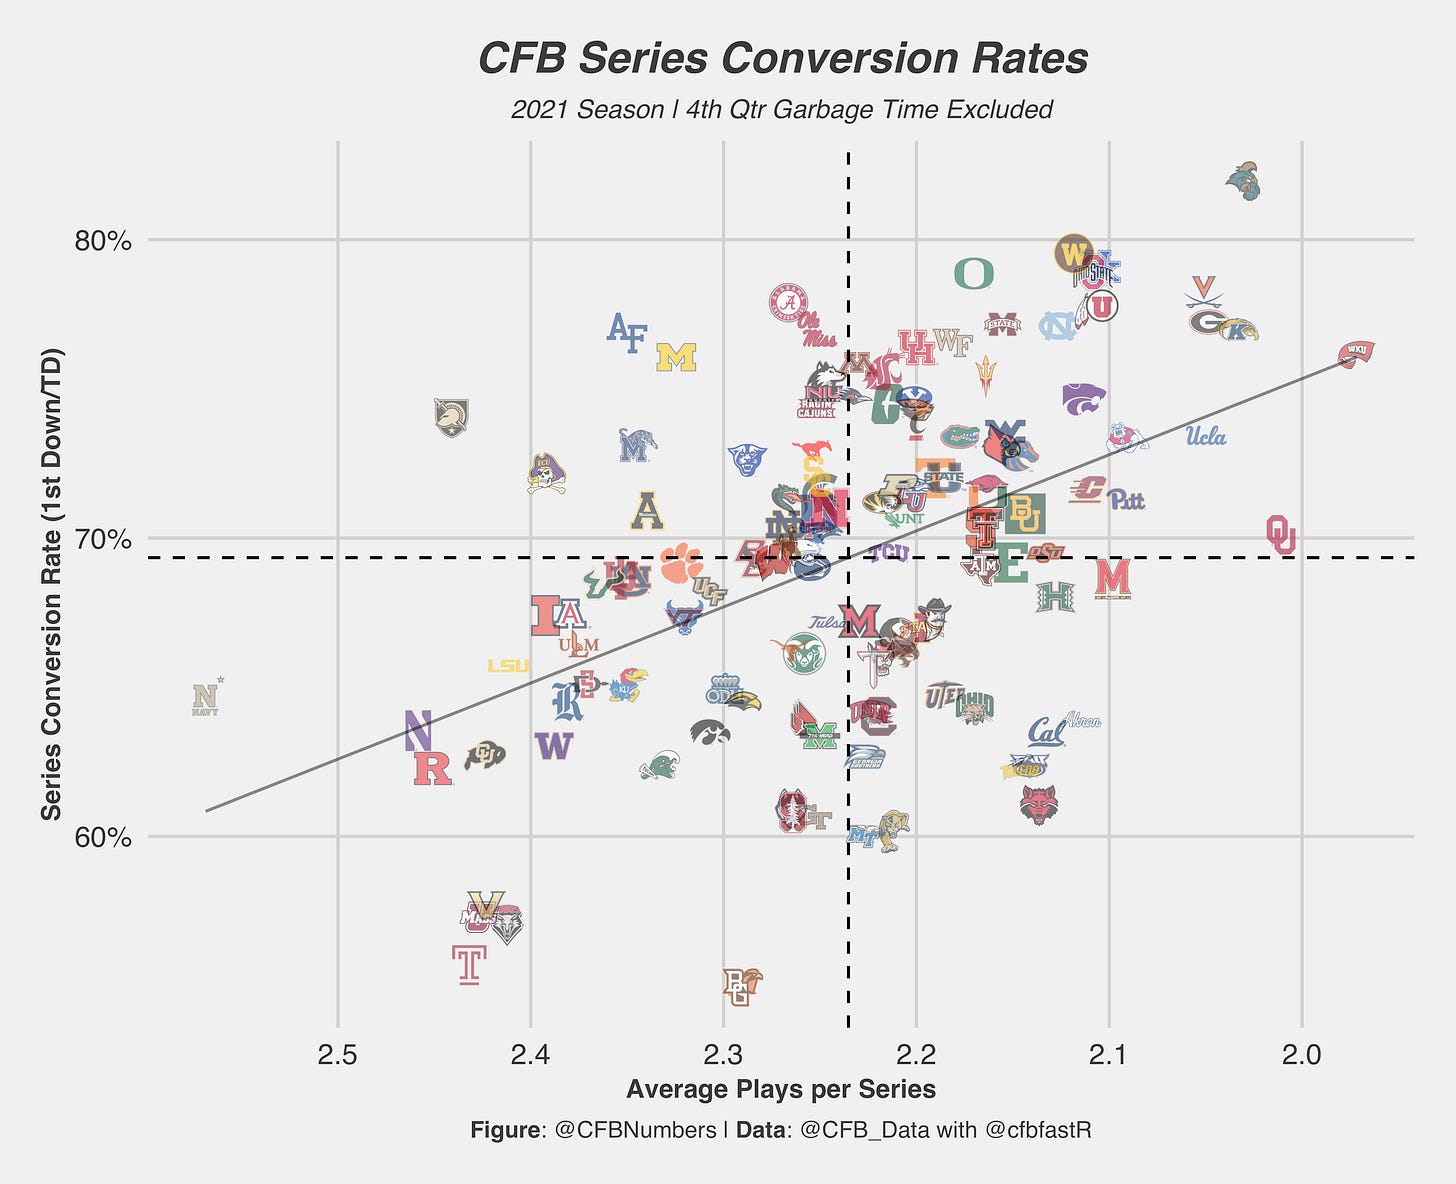
Here is how each team stacked up in terms of Series Conversion Rate in 2021. Pairing it with average plays per series, we can see which teams took more or less plays to convert a series, which is another way to look at an offenses explosiveness. As usual, the explosively efficient Coastal Carolina Chanticleers take home the crown for top SCR.
One of the biggest appeals to college football is the diversity of offensive schemes that are used. In the NFL you are more or less seeing replicas of the spread offense or the Shanahan wide zone offense. In College Football, you have anywhere from high octane air raid passing offenses to methodical run option based offenses. The services academies (Army, Air Force in particular), used their run heavy triple option to convert series at a high clip with a high amount of plays used per series. Western Kentucky, on the other hand, found success with an explosive pass heavy air raid offense. Then of course you have the Chanticleers, who combine option offense with explosive plays to create a work of art that destroys defenses. Offensives with wildly different schemes/goals getting the job done… music to my ears!
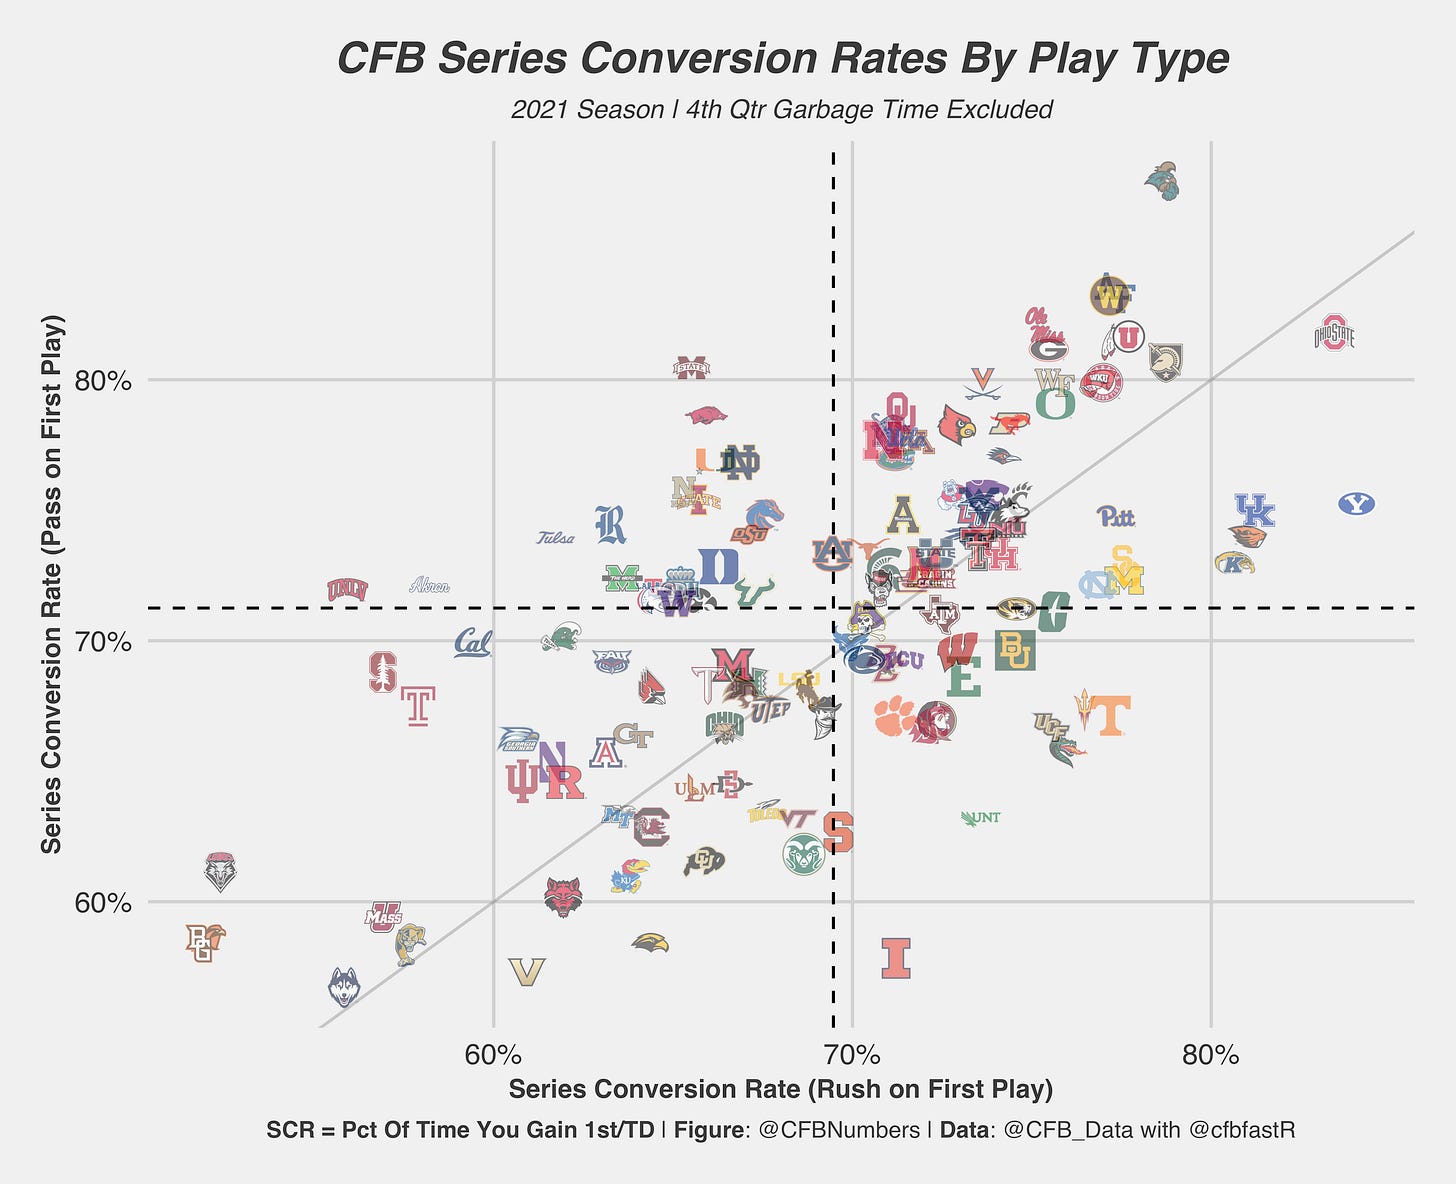
Teams above the line had greater success passing the ball first vs. rushing the ball and vice versa. As you can see, a majority of teams in college had greater success passing the ball to start their series. Teams in the top left quadrant should probably focus a lot more on passing the ball, while teams in the bottom left quadrant should focus more on their running game.
The Dominance Of Georgia’s Defense
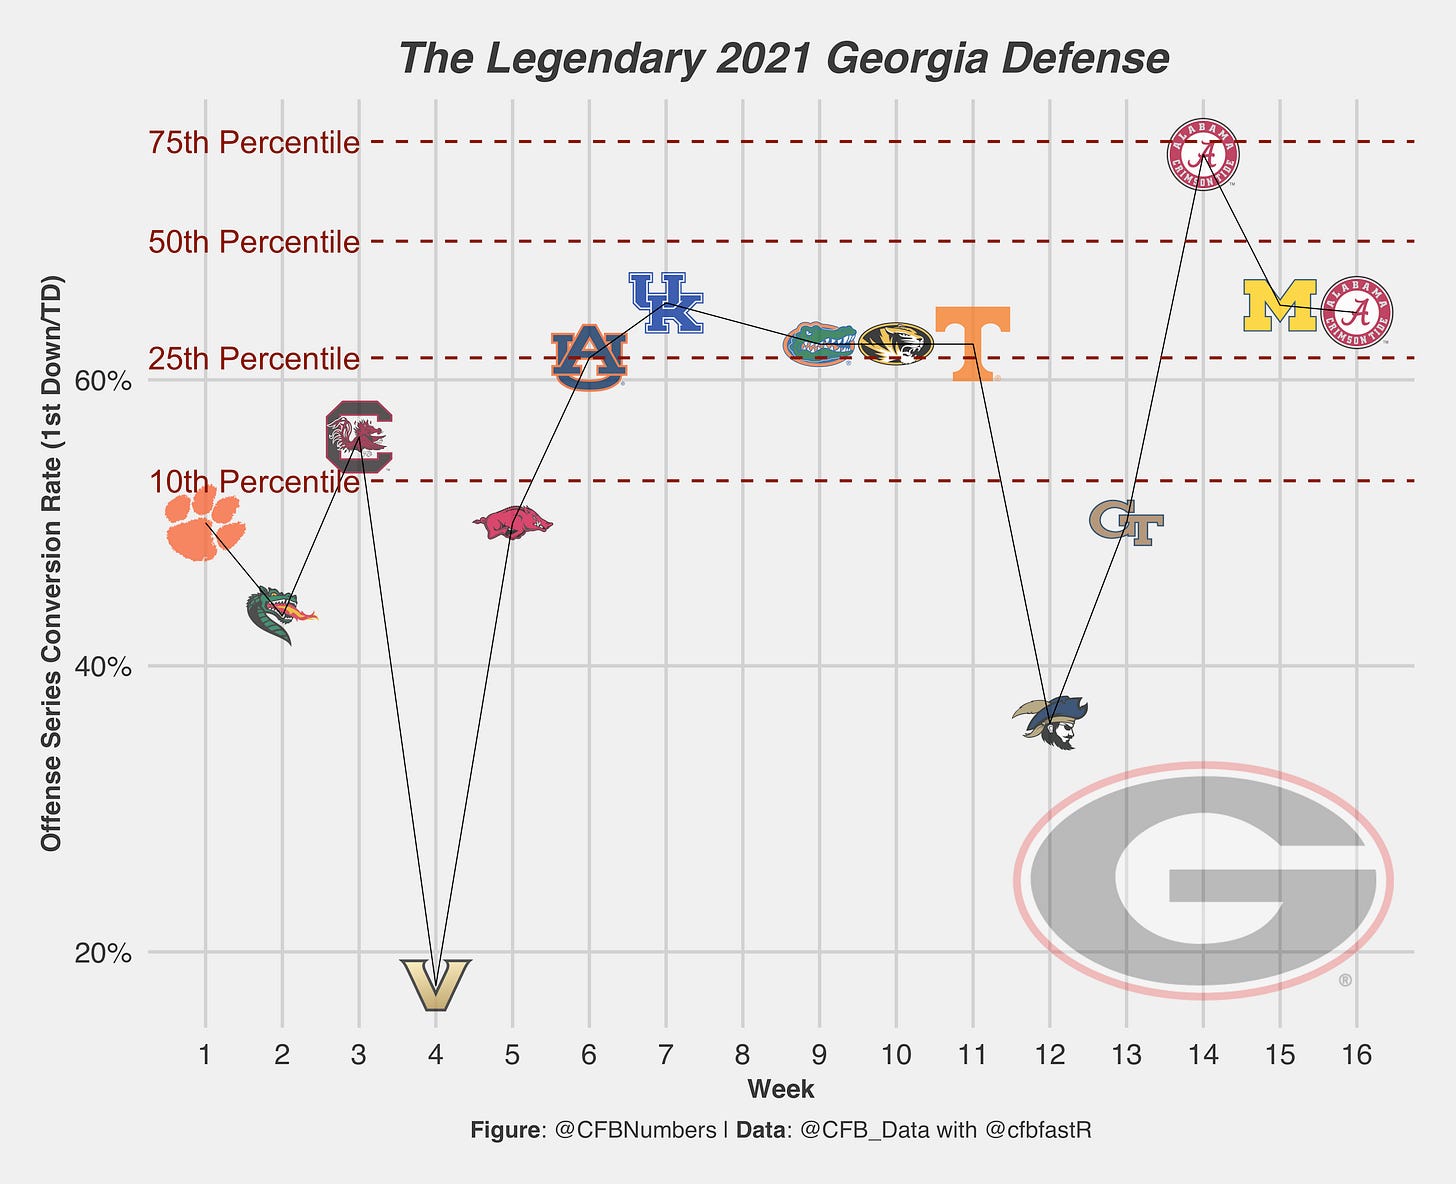
Im sure those outside of Athens may not want another metric showing off the dominance of Georgia, but I had to look for myself. Six of the Bulldogs opponents were held to series conversion rates in the bottom 10th percentile of all offenses. Outside of their lone loss in the SEC championship game, their defense held all opponents under the 50th percentile. This defense should be talked about as one of the best the sport has ever seen.
Mixed Effect Model
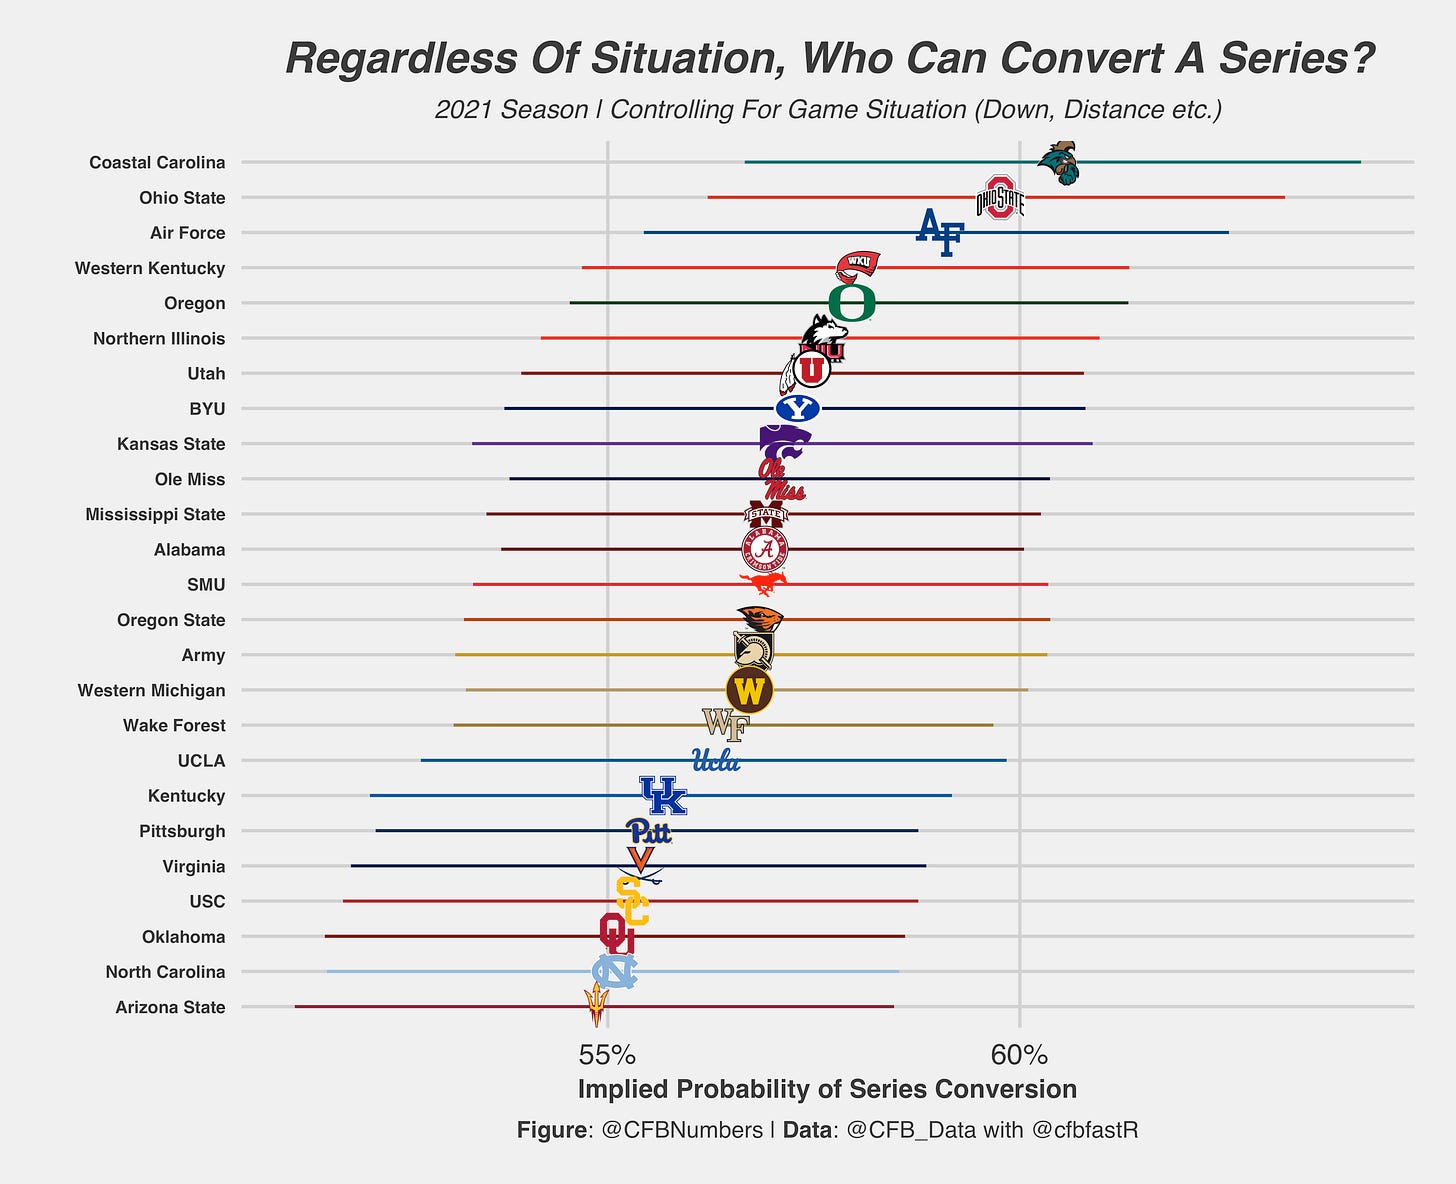
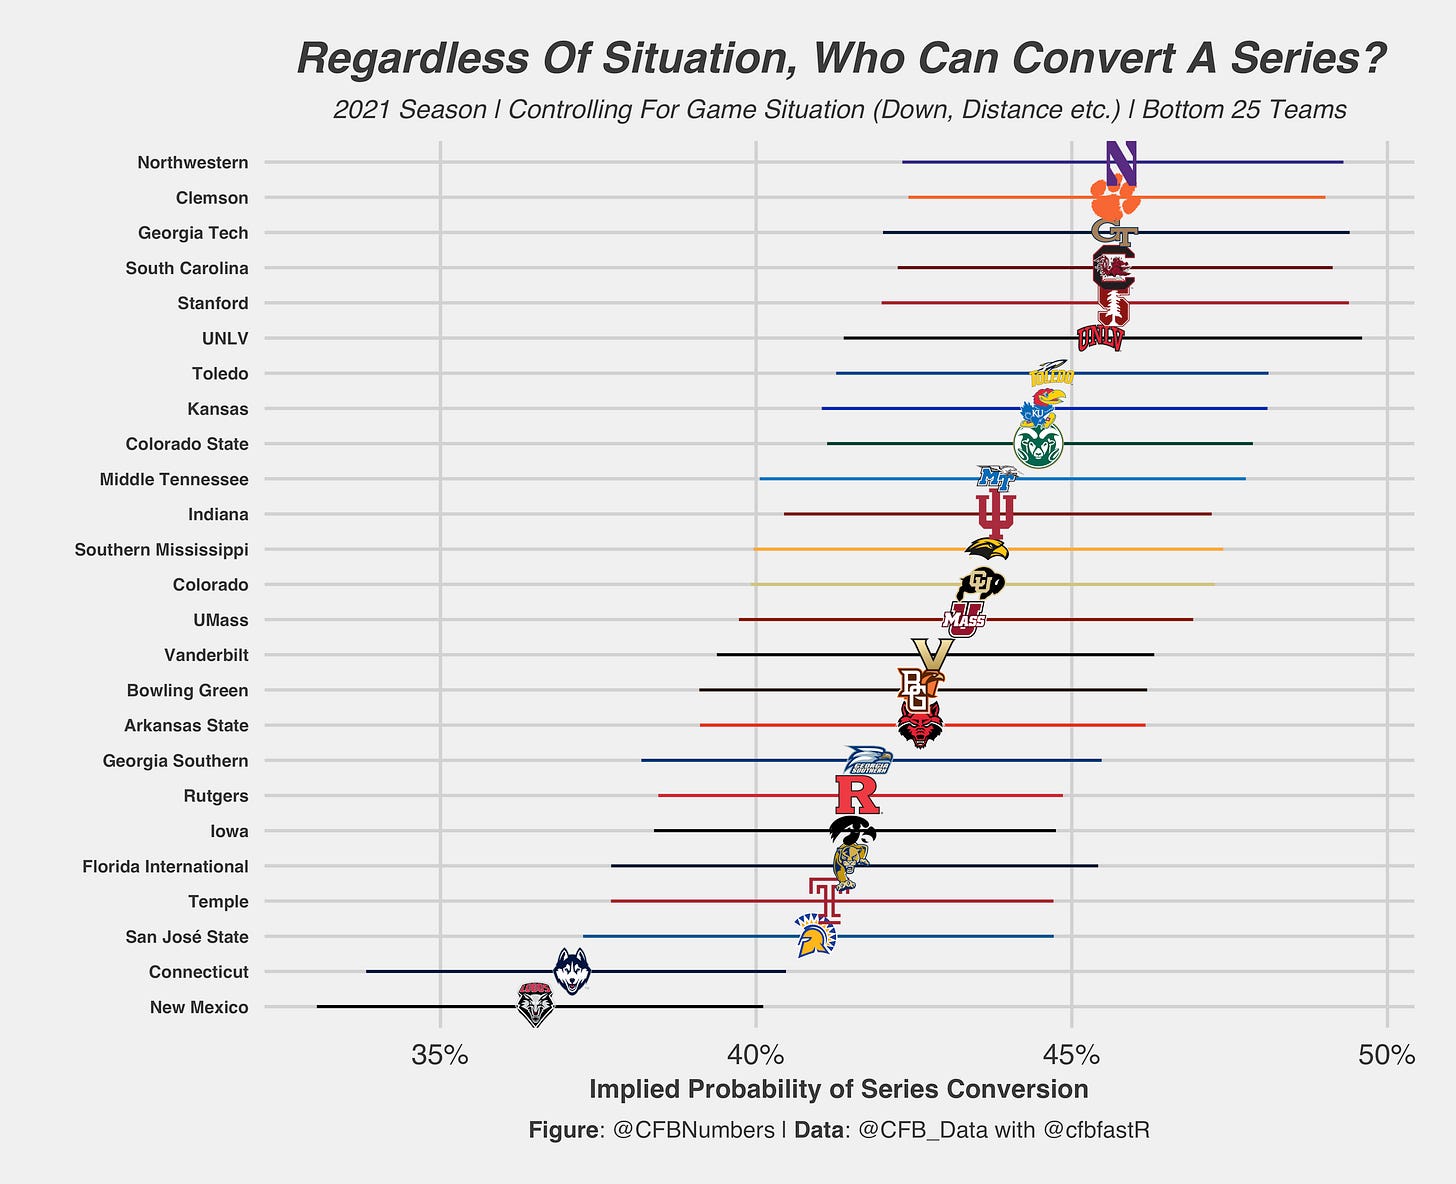
To conclude our initial dive into series conversion rate, we can add a little bit more context to the metric by looking into the odds a team converts a series after controlling for the game situation (Down, distance, score etc.). To accomplish this, we can use what is called a mixed effect logistic regression to estimate the probability of series conversion. If you want to learn more about mixed effects logistic regression, you can check out this out.
These were the top 25 teams when controlling for game situation. Even when you control for situation and game opponent, our Chanticleers still reign supreme. I stated it before, but the top 4 teams alternate between run/option heavy teams, and teams that like to attack with a more vertical passing game.
This is what the bottom 25 looked like for the 2021 season. You will notice that the Clemson Tigers were among one of the worst offenses at converting a series. Considering they still won double digit games, it is astonishing how much their defense carried the team. One would think if they had even a league average rate they may have made the playoff or even had a rematch with Georgia in the National Championship.
Series Conversion Rate is just one of the many pieces of information we can use to look at the health of a teams offense. Series level analysis gives us another level of efficiency analysis, a different approach to explosiveness, and another piece of information when deciding whether to adopt pass/run heavy offenses. As is usually the case, this is just the tip of the iceberg. Over time we will continue to incorporate series level data in order get an even clearer picture of offensive production.
If you want to dive in to the data like I do, check out @CFB_Data and @cfbfastR on Twitter, where you can learn how to get started in the world of College Football data analysis!
If you want to see more charts and one off analysis, follow my twitter page, @CFBNumbers


