Expected Success Rate: 2021 NFL Draft QB Prospects
Situational analysis of the top draft prospects
Im sure by now you have consumed all sorts of NFL draft content, from mock drafts to draft profiles and more. So this article will be introducing something just a little bit different into the draftverse. I will be doing a little situational analysis of the top QB prospects of the 2021 NFL Draft, but I will be using a brand new model I created called “Expected Success Rate”. Depending on where you look you will see various ways on how a play is deemed “successful”. They all typically yield similar results, but for this model a play is defined as successful if it meets the following criteria:
Gain 40% of the available yards on first down (ex: 4+ yards on first and 10)
Gain 60% of the available yards on second down (ex: 3+ yards on 2nd and 5)
Convert on either 3rd or 4th down
Pretty straightforward right? I won’t bore you with the intricacies of the model, but it essentially looks at the context of the play (down, distance to convert, quarter, time remaining, score differential etc.) and predicts how often a play is successful. One thing the model does not account for is team strength on both sides of the ball. Think of it more as a baseline reading for how often a play is successful.
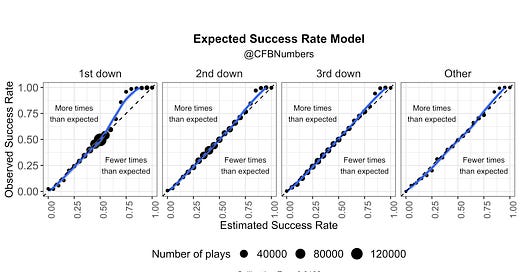
As you can see from the graph, the model is well calibrated, with an error rate of about 1%. It would appear most of that error is coming from cases with very high expected rates of success. For now we will live with the 1% and carry on to some draft analysis!
Part 1: Down Type
How a QB fares in early down play (1st/2nd down) versus late downs (3/4th down) can give us some indications on where their college production came. Were they able to succeed early on in the series or did they have to provide some late down heroics? It can also provide some insight into how a QB performs when they’re backed up in an unfavorable position. The beauty of the model is due to its ability to examine the context of a situation, we can use expected success rate to gauge which QB’s were in more favorable situations vs. their counterparts.
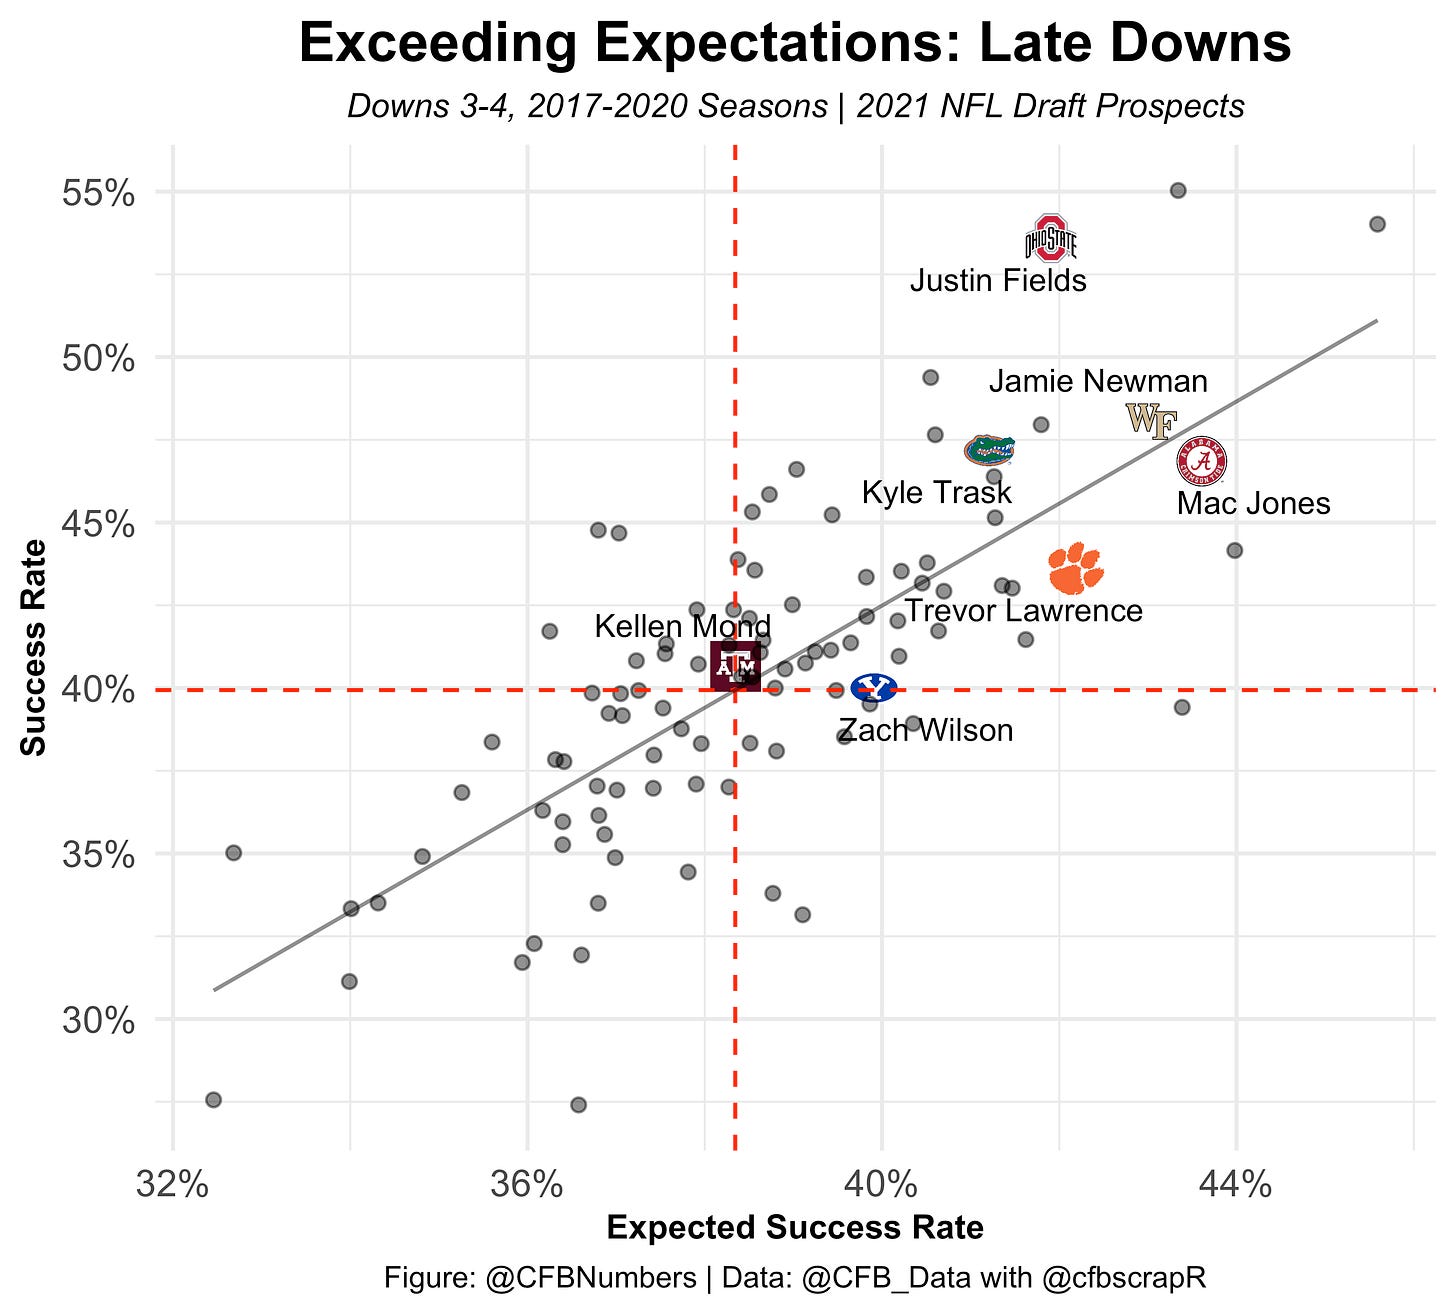
It doesn’t seem surprising that the three QB’s in the more favorable positions are the three QB’s from dominant powerhouse schools. Justin Fields of Ohio State leads the way in average early down expected success rate, while Alabama’s Mac Jones leads in late down average expected success rate. Wake Forest’s Jamie Newman seems to find himself in much favorable situations in the late downs compared to early downs, which will become abundantly clear when we compare these to their actual success rates. Speaking of which:
Early downs were not Jamie Newman’s cup of tea. Mac Jones did most of his damage in the early downs, which was evident watching him and Devonta Smith light up scoreboards each Saturday this past fall. In the battle for QB2, Zach Wilson edges out Justin Fields with a slightly higher Success Rate Over Expectation, which is taking their actual success rate and subtracting it from what they were expected to achieve. Here is how each QB ranks in Success Rate Over Expectation (SROE):
Mac Jones (Alabama): 11.5%
Kyle Trask (Florida): 6.33%
Zach Wilson (BYU): 5.70%
Justin Fields (Ohio State): 4.25%
Trevor Lawerence (Clemson): 2.49%
Kellen Mond (Texas A&M): 2.28%
Jamie Newman (Wake Forest): -3.93%
If you were a fan of Jamie Newman as a sleeper in the mid-late rounds of the draft, fear not, because we are now transitioning over to the late downs:
Jamie Newman does a complete 180 when it comes to late downs, going from -3.93% SROE in the early downs to an elite 5.02% SROE. His ability to extend plays with his legs certainly helps him get out of tough late down situations. The late down king, however, belongs to Justin Fields with an elite 11.7% SROE. An interesting note is how Zach Wilson struggled in the late downs. He was dominant in the early downs, so for the most part it did not matter, but when he got into a hole he seemed to struggle to dig himself out. Here is how the QB’s rank in SROE on late downs:
Justin Fields (Ohio State): 11.7%
Kyle Trask (Florida): 5.97%
Jamie Newman (Wake Forest): 5.02%
Mac Jones (Alabama): 3.24%
Kellen Mond (Texas A&M): 2.30%
Trevor Lawrence (Clemson): 1.42%
Zach Wilson (BYU): 0.09%
A little note of consistency: Kyle Trask finished 2nd in both late and early down SROE among these QB prospects.
Part 2: Half
How many times have you heard or used the phrase “Its okay, we’re a second half team!”. It can be hard to evaluate QB’s on the college level given the vast talent gap between teams. If you have tuned into the second half of a Alabama, Ohio State or Clemson regular season game, odds are the game is probably over. In some cases these teams come into the game with a pre game win probability well into the 90’s. This is another instance where the model can identify when teams might be less successful because they are playing more conservative to chew up the clock.
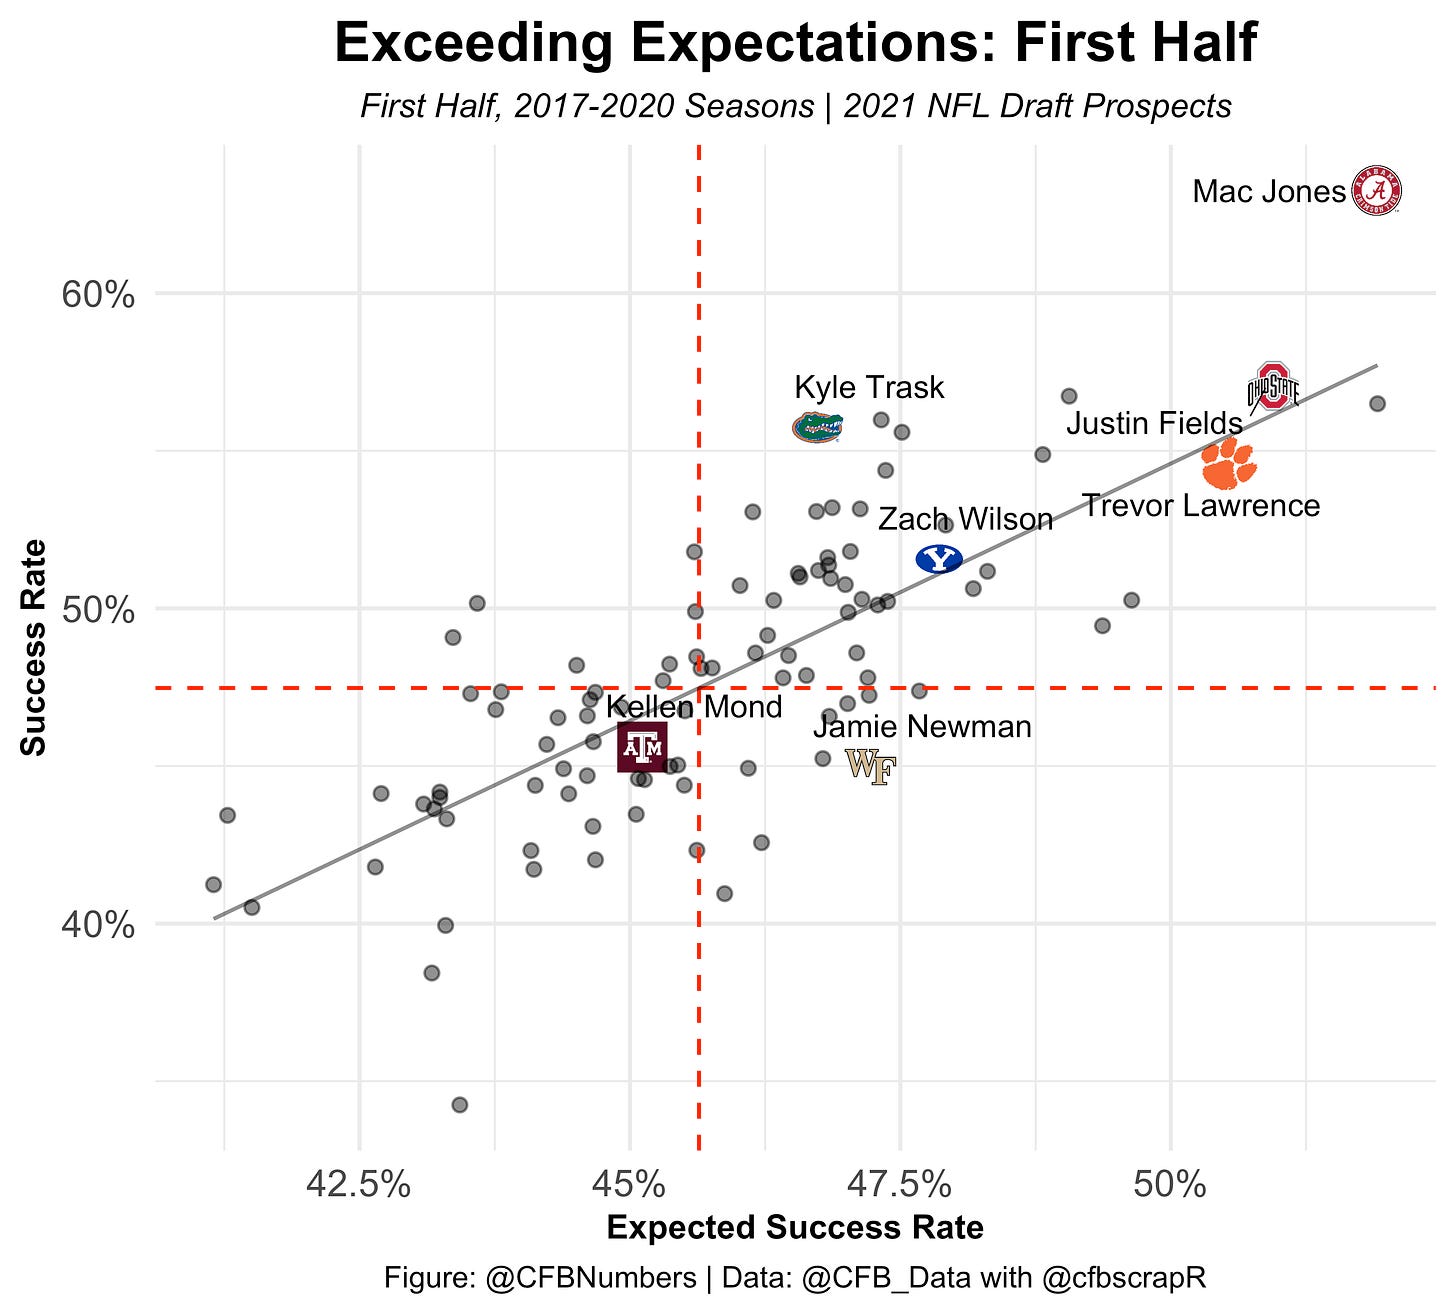
A similar story to down type favorability, the trio of Justin Fields, Trevor Lawrence and Mac Jones find themselves in the more favorable situations. The next trio of Trask, Newman and Wilson aren’t too far behind, with only Kellen Mond finding himself in less than ideal situations on average. With that being said, which QB’s translated this into actual success?
This isn’t exactly the most surprising analysis, but Mac Jones came out of the gates firing. His first half SROE of 11.4% was far an away the best of the bunch, with Kyle Trask finishing in 2nd (the pattern continues). Following a similar trend to down type, Jamie Newman struggled in the first half of games, finishing with a -2.25% SROE. Here are the SROE rankings for the first half:
Mac Jones (Alabama): 11.4%
Kyle Trask (Florida): 9.01%
Justin Fields (Ohio State): 6.11%
Trevor Lawrence (Clemson): 4.06%
Zach Wilson (BYU): 3.70%
Kellen Mond: 0.48%
Jamie Newman (Wake Forest): -2.25%
Justin Fields has a very slight edge in actual second half success rate, but due to his higher expected success rate, the king of the second half belong to Mac Jones and his 6.58% SROE. The biggest drop belongs to the number 1 overall pick, Trevor Lawrence. His -1.61% SROE is the worst among the QB’s in this group. My first thought was conservatism with a big lead, but its hard to make that argument when Fields and Mac Jones have had just as many big leads. If there was ever a flaw in the golden arms game, it might just be second performances. It will be interesting to see if this problem persists on the next level, when the talent gap narrows significantly.
This is just the beginning for Expected Success Rate. With this model we can dive in deeper and see when players failed in high expected success situations, and when they succeeded in the toughest spots. We can break down the plays to see what went wrong/right, and see if there are any hidden gems to their game. Its early in the draft process so for now we will leave it as this initial deep dive.
If you liked the graphs posted, follow my twitter @CFBNumbers
If you liked what you read, you can subscribe below! It is 100% free!


