Stadianalytics
One of those top 10 lists, but using numbers!
Its about that time in the summer offseason when we start to see “Top 10” lists and hypotheticals about legendary teams from the past. Sometimes you get good friendly arguments, while other times…. you just want to log off the internet for a couple of days. For this list instead of using our gut instinct, or trying to get as many fanbases mad at one time, we will be using good old fashioned numbers.
We will be looking at the various stadiums across college football, and determining which stadiums provide the toughest tests to opponents.
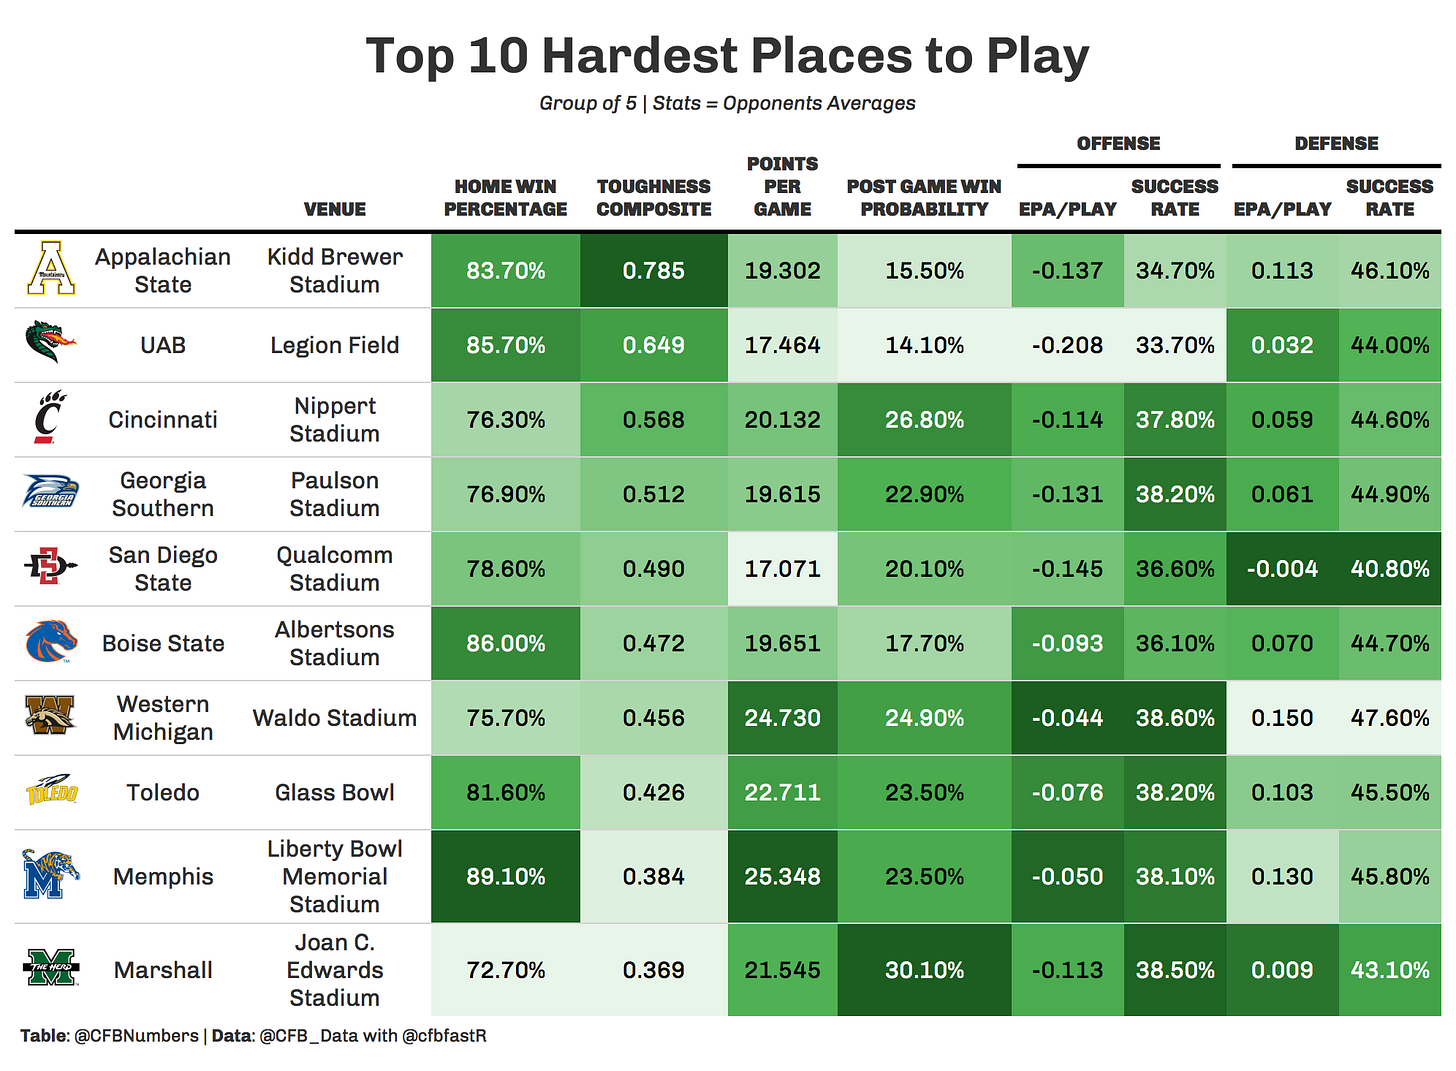
Given the nature and occasional wacky randomness of football, just looking at wins and losses when determining tough places to play seems lacking in substance. This is why I created the Toughness composite. The Toughness composite is quite simply a composite of opponents average advanced stats while playing in the stadium. The stats in question include: post game win probability, points per game, Expected Points Added per play, success rate, and explosiveness (which is simply the average EPA/play on successful plays). These numbers were taken from both the offensive and defensive sides of the ball.
As you can see above, the toughest composite has correlated well with wins in the CFP era. Teams above the line have gotten away with more wins despite their toughness composite, while teams below the line probably should have won more games at home.
According to the toughness composite, these are the ten hardest places to play in the power 5 (little transparency: as a FSU alum I almost canned this idea after seeing this table, but I shall swallow with pride). No surprise to anyone to see who is number 1 on the list. On average, visitors of Bryant Denny Stadium achieve a post game win probability of 4.8%. Basically you take your beating, then head to the airport. It is interesting to see the Big 10 well represented in this list. I think another step forward in the analysis would be to see if those colder fall/winter climates have any effect on opponents.
I don’t know what it is about Appalachian State, whether its the infamous Michigan game, or just their overall success, but they fire me up every time I watch them play. They take home the top spot in the group of 5 according to the toughness composite. Contrary to the P5 list, only 3 teams sport home win percentages over 85% (Power 5 had 6 over the 85% mark). We also see a bit more points scored per game on the G5 level vs. the P5. Despite being further down on the list, Memphis boasts the highest home win percentage at 89.10%. Unfortunately for the Boise State Broncos, awesome blue field was not a variable looked at for this composite. Nevertheless, they still make the top ten and were just narrowly overtaken by fellow Mountain West competitor San Diego State.
That ladies and gentlemen is the toughness composite! A nice simple way to add a little wrinkle to the famous “Hardest places to play” argument. It should be noted that this is the entire CFP era, so teams like UCF wouldn’t necessarily make the top ten due to some rocky seasons to start the era. You could also adjust by conference and add more variables if you wanted to do a more in depth analysis. Either way, this is a simple way to add a little context to an age old debate.
If you want to dive in to the data like I do, check out @CFB_Data and @cfbfastR on Twitter, where you can learn how to get started in the world of College Football data analysis!
If you want to see more charts and one off analysis, follow my twitter page, @CFBNumbers


