Statistical Properties of the CFB Transfer Portal (Part 1): By Bud Davis
The transfer portal has taken CFB by storm. Bud walks you though how it's changing the game
The NCAA CFB Transfer Portal has been around since 2018. Over the past four seasons, thousands of FBS players have entered the portal and transferred programs. Even with the complicating factors of COVID and NIL, enough data has been collected over the past four seasons to characterize the types of recruits that are most likely to transfer. Below I'll present the first part of my findings. Overall, I found the results of this effort to be intuitive. In this first portal data dive I have mainly focused on characterizing recruit properties that seem to lead to higher rates of transfer (i.e., we will ignore their specific collegiate history for now).
TLDR: Higher transfer rates are associated with
Skill positions (likely reflects development lag for trench players)
Playing time competition
Larger recruiting classes
Higher scoring recruiting classes
4-Star recruits
Seniority (annual 4-6% transfer rate for each recruiting class)
Recruits from the Southeast/Northeast
Recruits who go to school further from home
Data
The data were developed from https://247sports.com/. The dataset includes information for 16,964 recruits rated by 247 Sports for the 2016-2021 recruiting classes. Unrated recruits or default rated recruits were not included to avoid issues with walk-ons. Transfer information was derived from 247's tracking of the portal between 2019-2022. Transfer information was current as of 1 February 2022. Of the 16,964 recruits in our dataset, 4,174 (24.6%) were identified as having entered the portal and 2,743 (16.2%) transferred from the team they initially committed to out of high school. In general, this suggests roughly 1 in 4 recruits will enter the portal and 1 in 6 will transfer.
Both the recruit and transfer information tracked by 247 is likely biased towards 247's target audience. It is much more likely for 247 to have rated a P5 player and tracked that player's transfer, than it is for 247 to have rated and tracked a lower-level G5 program player.
While, I don't think this significantly alters the findings below, it is worth considering across this study.
Competition Level
One of the most surprising findings of this work is that most transfers involved players moving down in competition level. While high-prestige transfers between P5 programs (e.g., Justin Fields or Caleb Williams) garner most of the media attention, they are generally the exception rather than the rule. Most P5 players who transfer are heading down in competition level, to G5 or non-FBS programs. Similarly, more G5 transfers involve players heading down to the non-FBS level than moving up to the P5 level. The P5 level is a net exporter of players (-915) via the portal. The G5 level appears to be roughly neutral (-20), with similar amounts of players entering and leaving. Non-FBS programs appear to be net importers (+935), with significantly more players added than lost via the portal (based on 247 data). Overall the transfer portal largely seems to function to help players who are struggling to find success at their current competition level, move either up or down to a more-suitable level of competition.
Position
I think this is one of my favorite results to fall out of this project mainly because it just feels so right. Skill position players transfer at a higher rate than their trench position peers. At first, I thought this might reflect a lack of rotational reps during each game. DL and EDGE players are regularly cycled during a game, but QBs and DB’s are less likely to be substituted. But then I saw the IOL and OT transfer rates, which despite not being heavily rotated positions, are lower than DL and EDGE. My preferred explanation is that physical development is a major factor influencing transfers. OL and DL recruits usually require a couple years in a college nutrition and strength/conditioning program before they are ready to contribute. Whereas DB’s and WRs may come in as freshmen at a height and weight similar to what they will play at throughout their collegiate careers. I doubt that skill position players are, in aggregate, more-selfish than their trench position peers.
My takeaway from this is that positions that require less physical development to be game ready, are more likely to see transfers.
Recruiting Class Size
Perhaps not surprisingly, larger recruiting classes are associated with higher transfer rates. For recruiting classes of 20 players or less, the rate of transfers appears to be much lower than the FBS average. Recruiting classes that consist of 21-24 players have transfer rates at or slightly above average. For classes of 25 or more players, the transfer rate appears to be well above average.
These observations suggest that recruits are primarily transferring for playing time. In larger classes, there is increased competition for that playing time, and players are more likely to move to another program in order to find their place on the field.
Recruiting Class Quality
Using 247’s composite class score, we can see that higher rated recruiting classes have higher transfer rates. While this class score is influenced by recruiting class size, it is more strongly influenced by the quality of recruits within the class. Higher scoring classes are those that have amassed more highly rated talent. For reference, a Top 15 ranked class is around 250 points, a Top 20 recruiting class is around 225 points, and a Top 40 class is around 200 points. For class scores below 200 points, transfer rates are lower than the FBS average. Transfer rates climb steeply for class scores between 200-250. Transfer rates plateau for scores above 250 at a roughly 25% rate. These data suggest that as more football talent is aggregated, competition for playing time increases and transfer rates increase. Additionally, the plateauing of transfer rates at around 25% may suggest that there is an equilibrium, where once roughly ¼ of a class has transferred, playing time availability is no longer the primary issue, and transfer rates are unlikely to increase due to talent aggregation alone. Lastly, it is worth noting that because transfer rates plateau between 225-250 points, championship caliber recruiting (>278 score) does not appear to put a program at a significantly higher risk of transfers.
Recruit Quality
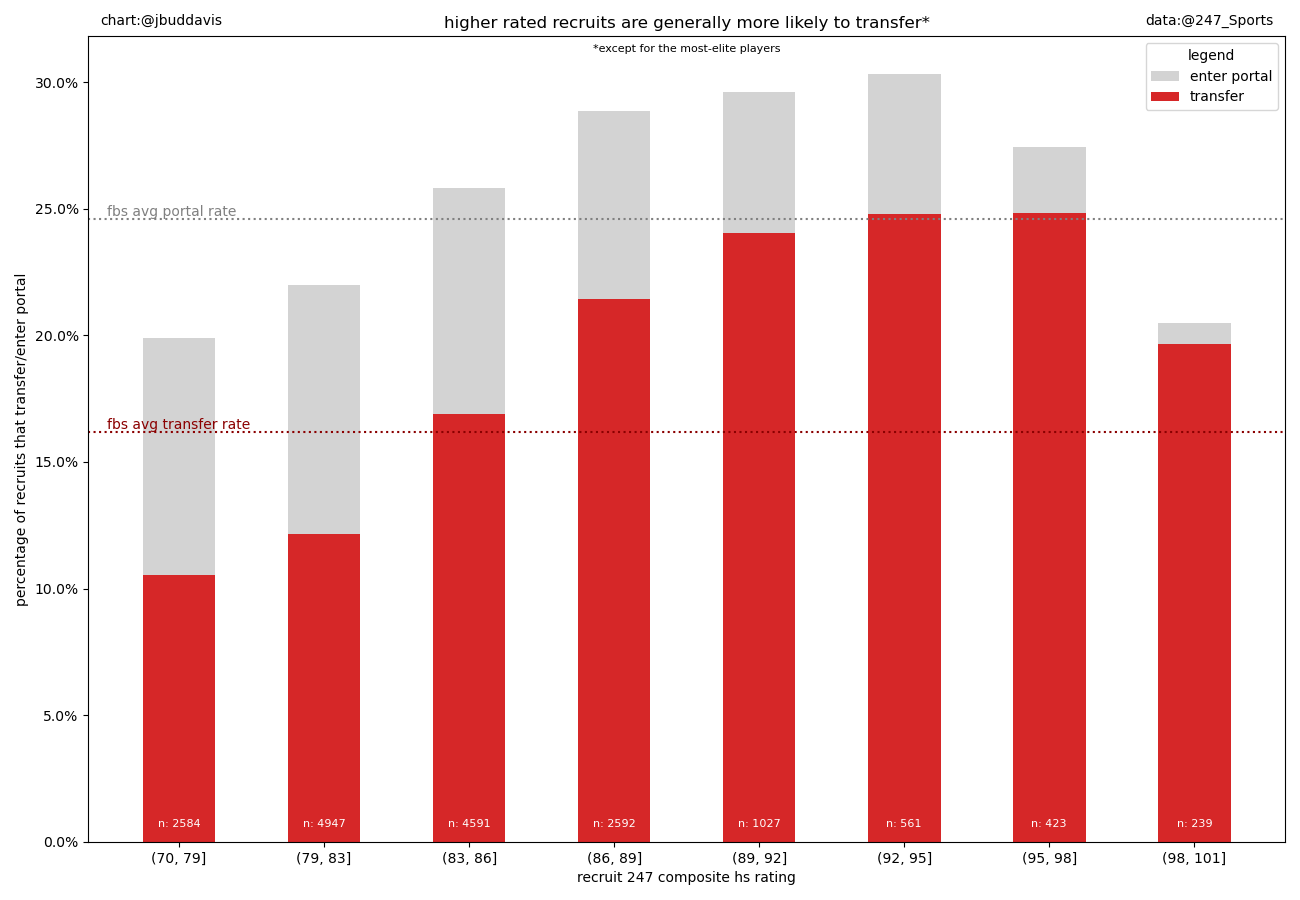
In terms of both recruit rating and recruit stars, we see a similar trend in terms of recruit quality and transfer rate. In general, higher ranked recruits transfer at higher rates than their lower ranked peers. This general trend probably reflects talent aggregation, since many highly rated recruits tend to commit to the same programs. Notably, the highest rated recruits (>98 rating & 5 stars) transfer at lower rates than the overall trend would suggest (i.e., 5 stars transfer at a lower rate than 4 stars). I have several explanations for why these highest rated recruits transfer at a lower rate: (1) highly sought after recruits are more selective in where they choose to go to school, (2) they are more physically ready to see early playing time, (3) they are more likely to have received early NIL compensation.
Conferences
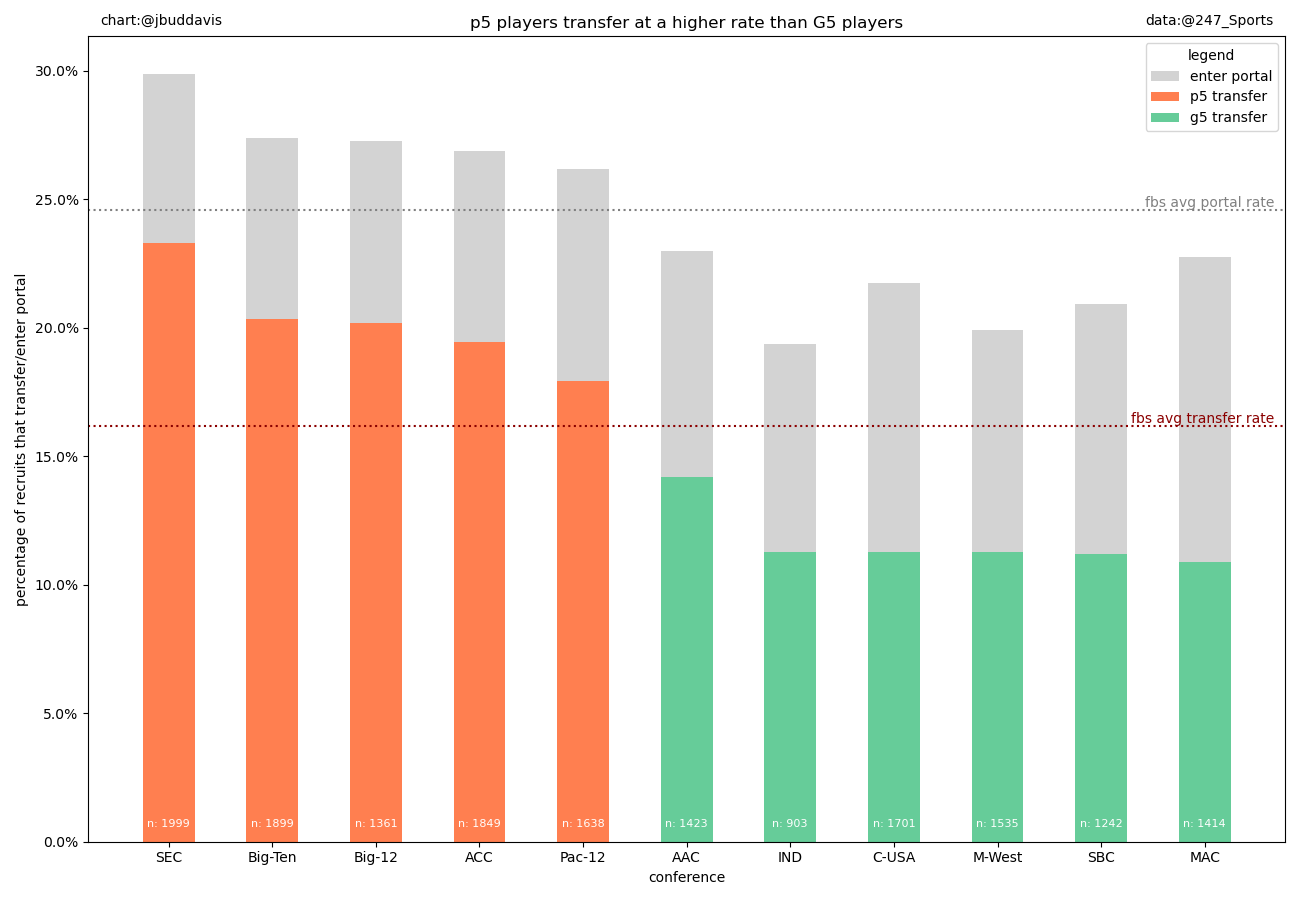
When we break down transfer rates by conference, we can see that P5 programs have a higher transfer rate than their G5 peers. This likely reflects that P5 programs aggregate more talent than their G5 counterparts. Across the P5 level, we see that transfer rates appear to be higher for conferences that aggregate more talent. The SEC likely has a higher transfer rate than the PAC-12 simply because SEC schools tend to recruit better than their PAC-12 counterparts.
Temporal Trends
When we look at our recruiting data by recruiting class, we can see that players from the 2018 recruiting class have the highest transfer rate. This makes sense, because the portal was introduced in 2018 and has been available to this class for their entire collegiate careers. Based on the monotonic trend between the 2018-2021 recruiting classes, it appears that roughly 4-6% of a recruiting class transfers each season. I expect the 2019 class to catch up with the 2018 class next year, and similarly expect the 2020 class to catch up in the next 2 years. As such, upperclassmen will tend to have higher transfer rates than underclassmen simply because upperclassmen have gone through more transfer cycles.
Spatial Trends
When we look at transfers by a player’s home state, we see that players from the Southeast and Northeast appear to have higher rates of transfer than their Midwest and Pacific peers. This may be a function of conference level talent aggregation or FBS program density. All that being said, I currently do not have a good explanation of why recruits from the Missouri-Arkansas-Louisiana area of the country appear to transfer at the highest rates.
Distance from Home
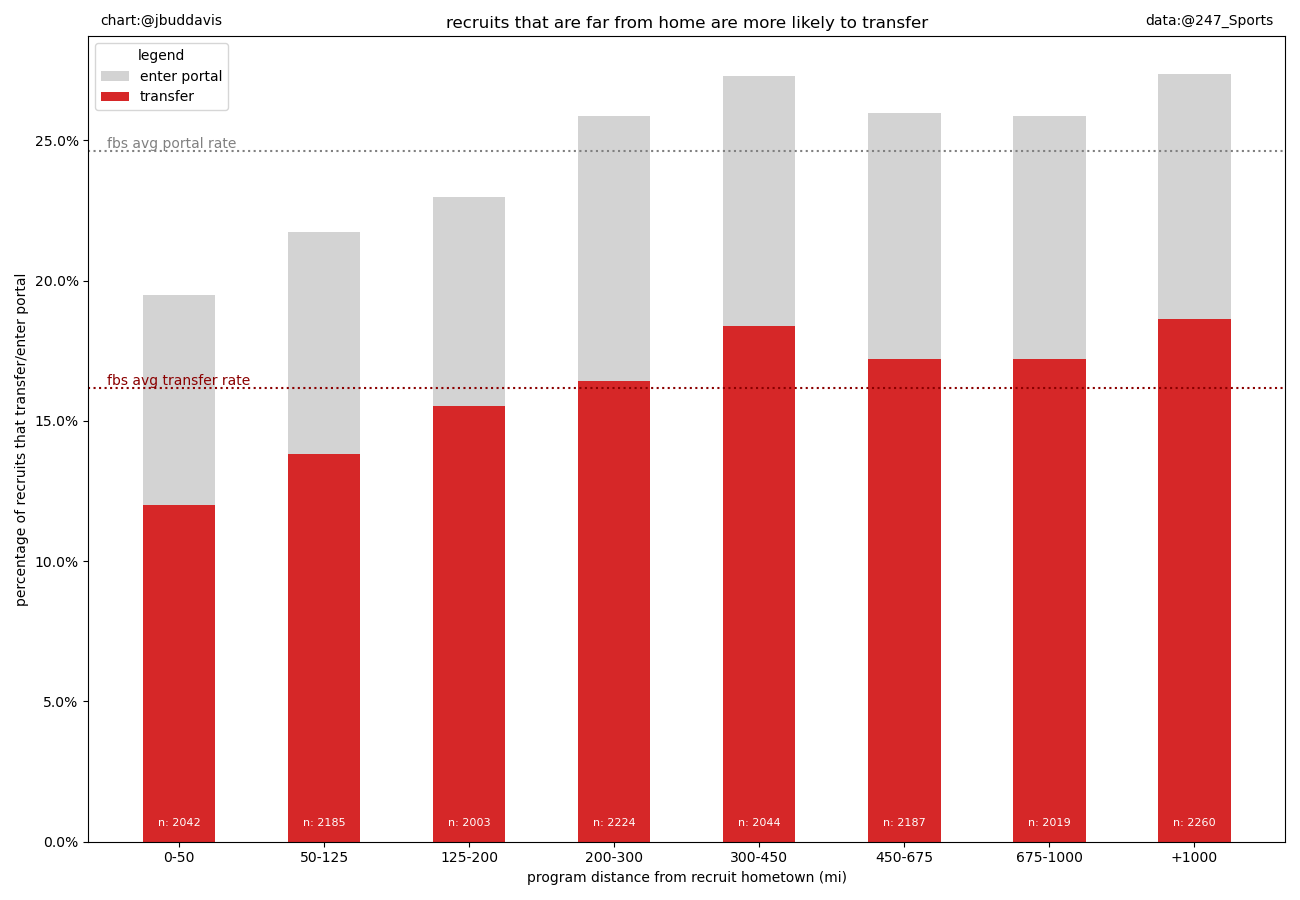
When we look at the distance between a program's football stadium and a player's hometown, we can see that players who go to school far from home are more likely to transfer. Players that go to school within 200 miles of their hometown transfer at a rate below the FBS average. Between 200-300 miles, recruits transfer at roughly an average rate. Players who go to school beyond 300 miles from their hometown appear to transfer at a much higher rate than their close-to-home peers.
The Worst Recruiting Classes
Now let's look at transfer rates by program-specific recruiting classes. Here we only looked at recruiting classes with at least 15 recruits, since small classes are more likely to suffer from 247 issues. With 11/21 players transferring (52.4%) Willie Taggart's 2018 transition class is the worst recruiting class in our dataset. This makes sense since it was a transition class, with 4 seasons of portal exposure, of a now replaced coach. However, many of the worst classes here (Stanford '16, Wyoming '18, Michigan '17, Alabama '19) are from relatively stable programs and coaches. These coaches both recruited this class and still coach at the institution today. So while coaching turnover may influence transition rates, coaching stability does not guarantee that players will not transfer. Investigating what leads to these exceptionally high transfer rates will be an area of study going forward.
Conclusions
Results from this analysis are largely intuitive. Players seem to use the transfer portal to find playing time. When programs recruit many talented players, they increase competition for playing time and will suffer from higher transfer rates. Players who transfer tend to seek out playing time by moving down in competition level. In general, higher rated recruits are more likely to transfer, however 5-star recruits break this trend and transfer at a slightly lower rate. Skill position players tend to transfer at a higher rate than trench players. This may reflect that many skill position players enter college with the physical tools and expectation of early playing time.
The Southeast and Northeast parts of the US seem to have higher rates of transfer than the Pacific and Midwest. Recruits that go to school far from home also seem more likely to transfer. While coaching transitions may encourage transfers to the highest rates, coaching stability does not appear to guarantee that high rates of transfer will be avoided. Most FBS programs can expect to lose 4-6% of a recruiting class every season to the portal.
Transfer Rates By Program
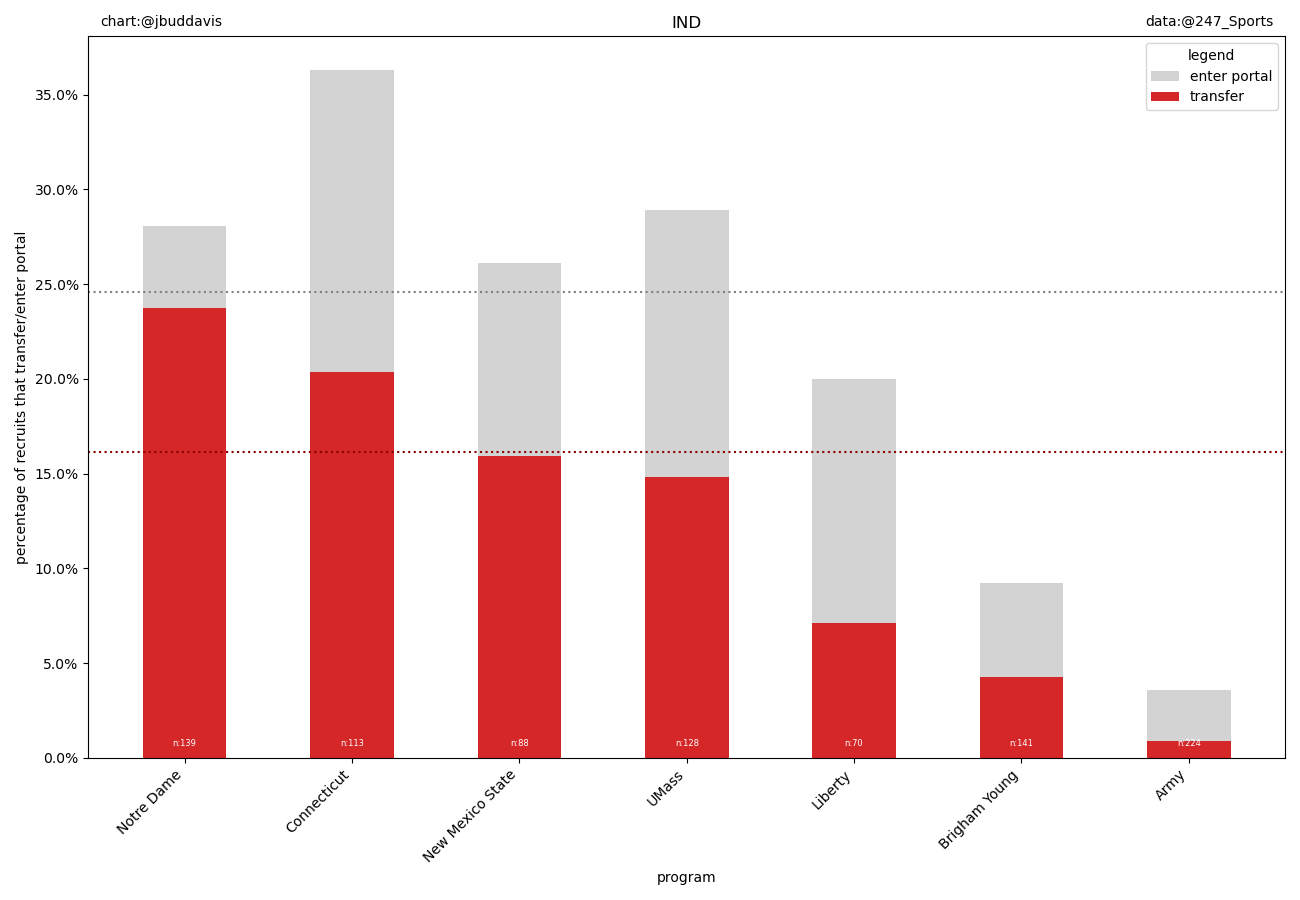
Below are the transfer rates for each program, grouped by conference. Remember, if your rival has a high transfer rate, it’s because nobody wants to play for them. And if you have a higher transfer rate than your rival, just say that it's because you have aggregated more talent,,,
Group of 5
If you want to see more amazing deep dives like this one, follow @JBudDavis on twitter.
If you want to dive in to the data like I do, check out @CFB_Data and @cfbfastR on Twitter, where you can learn how to get started in the world of College Football data analysis!
Thumbnail Photo: Kim Klement USA Today Sports


Do you have any data on the draft rates from each cohort? Might be able to make some inferences about relative talent levels of "transfer students" vs "non-transfer students" based on that.