The American Football Version of xG: Expected Passing Touchdowns
Diving deeper into the highly popular passing statistic
One of my favorite non American Football advanced metrics is Expected Goals (xG). Commonly found in sports such as soccer, hockey and even lacrosse, xG has become a staple in goal based sports. If you have never heard of xG and need a quick explanation, here is an excerpt from an article about xG on The Analyst:
“Expected goals (or xG) measures the quality of a chance by calculating the likelihood that it will be scored from a particular position on the pitch during a particular phase of play. This value is based on several factors from before the shot was taken. xG is measured on a scale between zero and one, where zero represents a chance that is impossible to score and one represents a chance that a player would be expected to score every single time”
I have always wanted to use the framework of xG in college football. The closest thing American Football has to “goals” would be field goals. However, there is already an amazing array of expected field goal analysis, and I wanted to do something a little different. Thats when I turned my attention to a metric everyone knows and loves: passing touchdowns.
Passing touchdowns are one of the most talked about stats when QB’s are discussed. We know from previous analysis that it isn’t necessarily the best way to evaluate QB’s, but nevertheless it will continue to dominate conversations for the foreseeable future. Passing touchdowns can take many forms. Some are RB screens turned 60 yard TD’s, while others are calculated shots into the endzone. For this article, we are going to focus on the latter, as they resemble a “shot on goal”.
Quick Methodology
Using PFF data, we are going to take every pass attempt from the 2018-2021 CFB seasons that had a target landing spot in the endzone and calculate the probability of a passing touchdown. Using the gradient boosted trees algorithm (via XGBoost, which you can learn more about here if you want!) we will train a model using the following inputs:
Game situation. This includes down, distance, yards to the endzone, time etc. You know when someone walks into the room and asks “Whats going on?” in relation to the game? Basically the answer to that question.
Location of the pass. This is our “shot on goal”. We look at how deep into the endzone the pass was, as well as where along the width of the field the pass landed.
Whether the QB was pressured or blitzed on the play.
Whether the pass was out of the shotgun or part of a Run Pass Option (RPO).
Feature Importance
Out of the variables used, here are the 10 most important ones when determining the probability of a passing touchdown, or as we will call it Expected Passing Touchdown (xPT). The most important variable in our model is time left in the half. If a team is short on time in the first half, or is trailing deep into the second half, they can’t really afford to run the ball or complete a ball short of the endzone. This is when teams start to take shots into the endzone. The closer you get to the end of the half, the lower your xPT is.
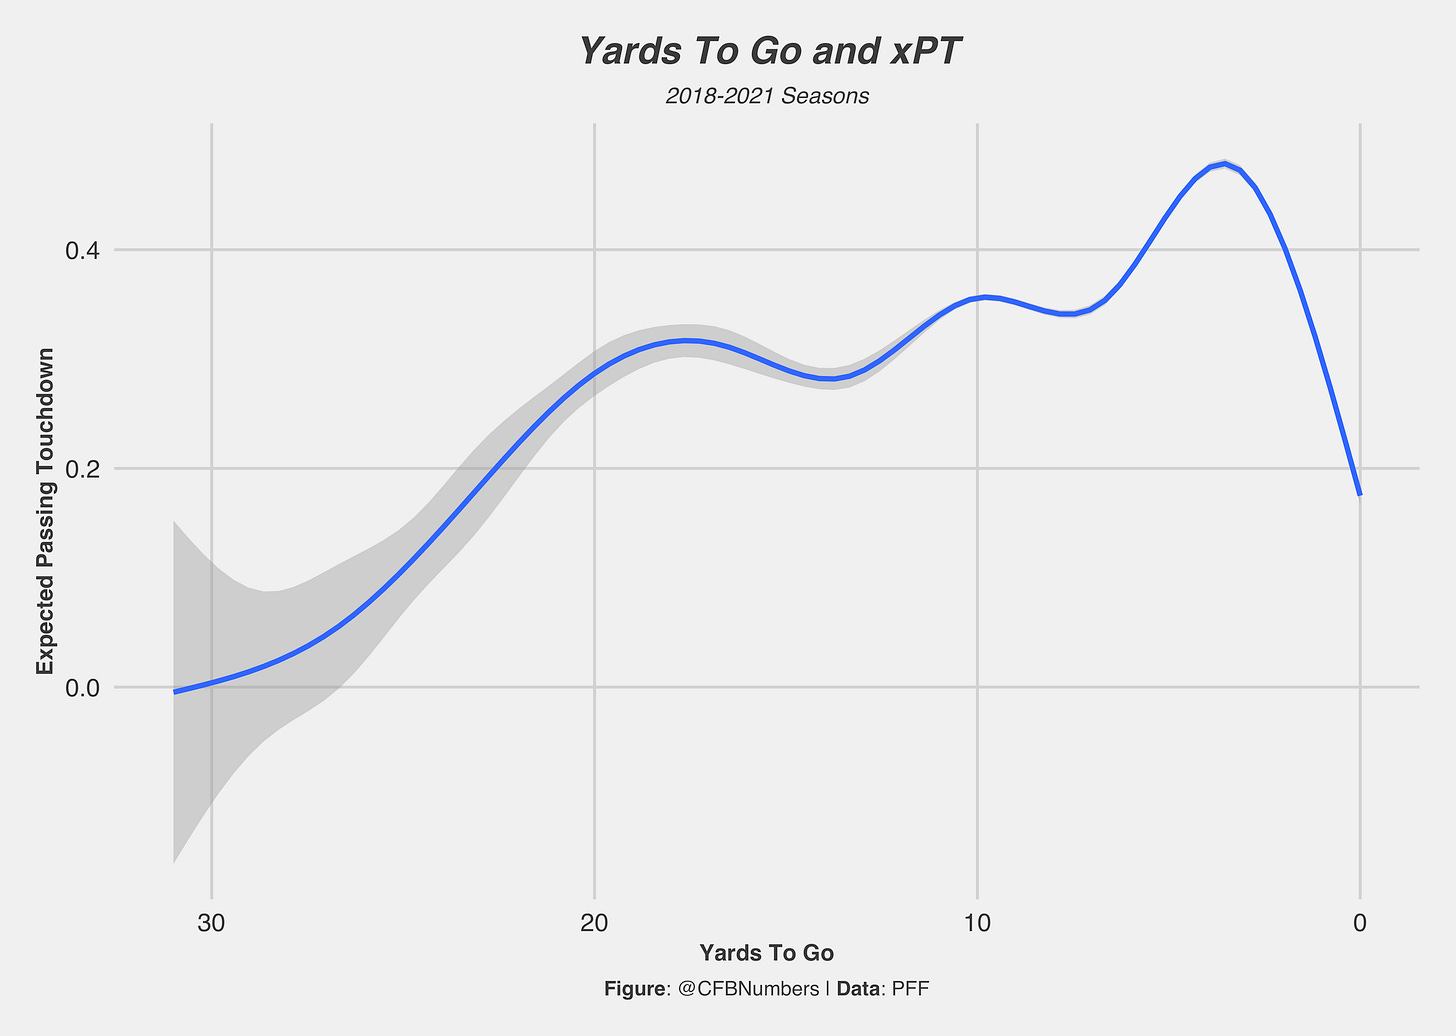
Yards to go in the down series also plays an important factor in xPT. Looking at the relationship between how many yards you have to go for a first down/touchdown and xPT can help you determine whether it is in your best interest to run or pass.
The sweet spot appears to be within that 5-10 yard range. Anything closer and your xPT starts to take a nose dive. When you’re that close to either gaining a first or scoring, it is in your best interest to run the ball.
Some football analytics analysts will tell you that passing touchdowns can largely be a function of how close you are to the endzone. This graph is exactly what they’re referring to. The closer you get to the endzone, the easier it is to take and complete shots into the endzone.
Pass Location Analysis
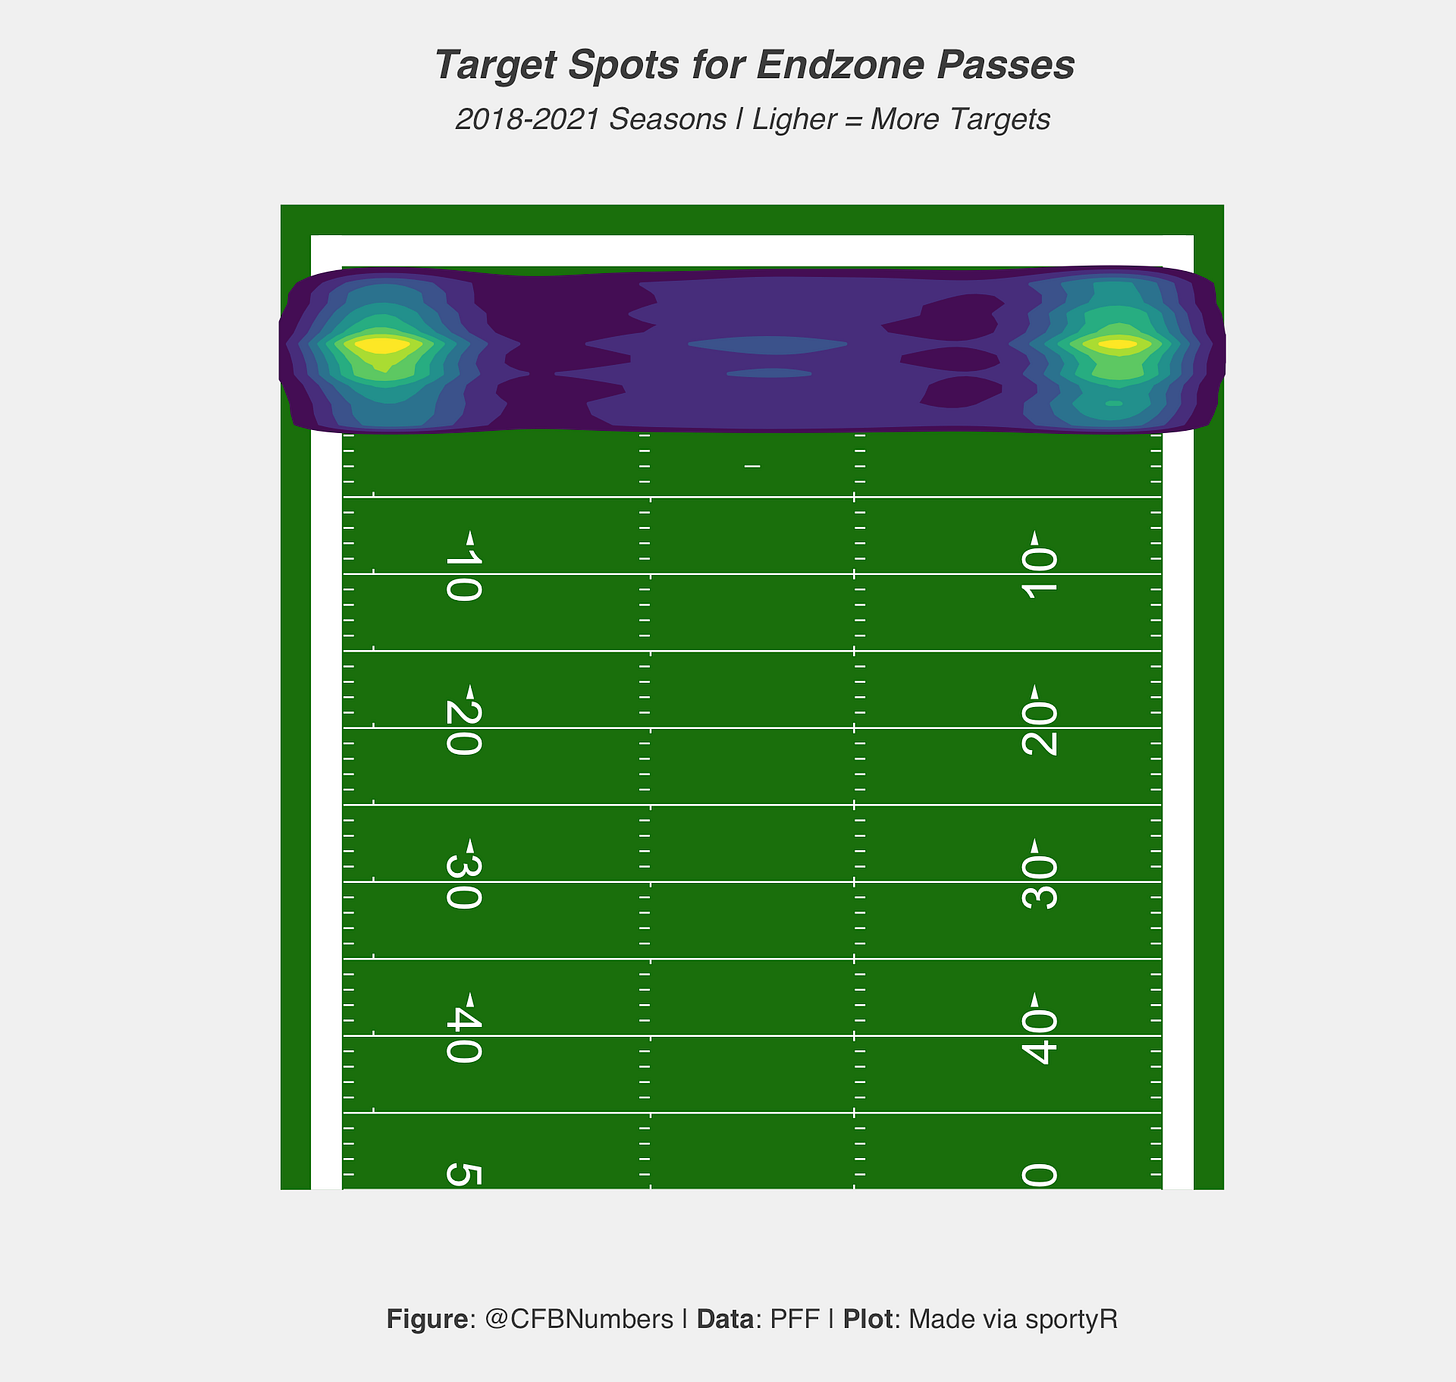
The most common areas for pass attempts in the endzone is the sides of the endzones. This can include anything from goal line fades, QB’s rolling out and hitting their man on the edge, or even deep shots on the go route. Passes into the endzone typically occur in the Red Zone/close to the endzone, so defenses naturally can bunch up in the middle of the field and take that away from the offense.
Outside of the red zone, teams still typically focus on the edges of the field. However, you can notice a little bit of a lighter patch in the middle of the endzone, which shows how teams do like to take shots down the middle if the defense is spread enough apart.
Interestingly enough, with deep shots the targets are almost all in the middle of the endzone. It is also interesting that the heat map also shifts a little bit to the right. As virtually all QB’s are right handed, this would show that deep shots tend to be with the QB’s body and not across from it.
Now that we know where pass locations will typically be in the endzone, we can look at how that corresponds to xPT. As we saw teams tend to target along the edges of the endzone when they’re closer to the goal line, and the middle when they’re further away. Are teams maximizing their xPT? Let’s find out!
xPT By Pass Location
In all situations, the middle of the field and the left edge of the endzone give you the highest xPT. That means shots to the right side, which include QB’s rolling out to their right side, don’t yield as much xPT as other areas of the endzone. The middle of the field, though under-targeted, is one of the higher xPT spots on the field. There is a lot of risk reward when targeting the middle of the endzone, especially when you’re closer and the defense can bunch up in the middle.
Isolating the passing attempts to just the red zone, and you get a similar result. We also see the same low xPT right side of the endzone. If your team can successfully scheme shots to the middle of the endzone, and your QB is talented enough to make those throws, you could be in for a whole lot of passing touchdowns.
Out side of the red zone, the story continues to stay the same. Shots to the right side of the endzone continue to yield very low xPT. The dots are sized relative to the amount of passes that are attempted from that particular spot, and as you can see it appears there isn’t much of a difference between the number of passes to the left or right of the endzone. Which makes the xPT difference even more interesting.
QB Analysis
There is still much more to be done in terms of analyzing how this applies to individual QB’s, but for now we can look at which QB’s had higher touchdowns over expected when targeting the endzone. The “over expectation” part is calculated by simply added up the xPT on every pass attempt for the QB.
For the Power 5, NC State QB Devin Leary and Oklahoma/Now USC QB Caleb Williams led the way in Touchdowns Over Expectation. Pairing it with their accuracy rate on endzone passes, and we can get a bit of a narrative going. TDOE is not stable year over year, which would indicate a high TDOE is most likely explained by situations the QB is in, and potentially their pass catchers making plays in low xPT situations. For Leary and Williams, their accuracy rate is well above average, so I would lean towards them being in low xPT situations more often than usual.
Purdue QB Aidan O’Connell had an above average accuracy rate, but wasn’t paid off for it in terms of passing touchdowns. On all passing TD’s (endzone shots/short of endzone), he finished 17th in the nation with 28 passing TD’s, but was 5th in QBR. This coupled with a well below average TDOE rate shows he was much better than his passing TD’s would indicate.
For the group of 5, Akron QB Zach Gibson was laser accurate on endzone passes. He has since moved on to Georgia Tech, and could be a bright spot for the Yellow Jackets if they decide to make the change from Jeff Sims. Draft QB’s Desmond Ridder, Carson Strong, Malik Willis, Bailey Zappe and Dustin Crum are all around the same accuracy rate on endzone passes, but have wildly different TDOE numbers. Zappe’s extremely low TDOE despite an above average accuracy rate means he could have potentially added to his FBS record 62 TD’s.
Speaking of the NFL Draft QB’s, I put a thread on twitter showcasing each of their endzone passing targets. It would have been a bit too long for this article, so I will link it here if you’re interested:


Conclusion
Expected Passing Touchdowns is one way to bring the highly popular xG metric to American Football. Accounting for game situation and passing location, we found that the left edge of the endzone and the middle of the field were the end zone spots that yielded the highest xPT. The right side of the endzone, though heavily targeted, was actually not a hot bed location for passing touchdowns. It would be interesting to take a deeper look into this to see why the right side seems to be a low xPT area.
A deeper dive into individual QB play and xPT will also be needed, which is something I will look into this summer. On an initial look it is not stable year to year, which would indicate it is more situation driven than individual play, which runs similar to passing touchdowns in general. One thing is for sure, passing touchdowns will always be the topic of discussion with QB’s, and teams should always look to maximize their shots in the endzone. With xPT, you just may be able to maximize those opportunities.
If you want to dive in to the data like I do, check out @CFB_Data and @cfbfastR on Twitter, where you can learn how to get started in the world of College Football data analysis!
If you want to see more charts and one off analysis, follow my twitter page, @CFBNumbers


