A Cluster-fun of Graphs: 2022 CFB Power 5 Review
Reflecting on a season the best way I know... clustering a lot of stuff together!
We’re officially in offseason mode. Aside from some down time and relaxation after a long season, the offseason mainly consists of four parts.
Reflecting on the 2022 season to see what we have learned about the CFB landscape.
The NFL Draft. A couple months of speculation, predictions, and absolutely insane #takes before we watch our favorite players graduate on to the next level.
Projects. The offseason is the perfect time to go under the hood of CFB and see what makes it tick. Everyone that does sports data analysis has a list of projects they want to get to *one day*, this offseason we will try to knock out a couple.
Gearing up for next season. This doesn’t happen until like July, but that’s when you really start to get antsy for the next season.
For now, we reside in the first part. The season is still fresh in our minds, so let’s do a little reflection on the past couple months. With the plethora of advanced metrics out there, it can make your head spin trying to create a story for the season. For that reason, we turn to one of our favorite methods: good ole’ fashioned clustering.
Clustering TLDR & Variables Used
If you’re newer to the newsletter, we use clustering to take a bunch of variables, standardize them so they’re all on the same scale, then feed those into the algorithm which will give us our grouped clusters. Its a very simple yet effective way to group a large amount of teams together and make observations based on those groups. For our team clustering, these are among the variables selected:
F+, SP+, FEI,- Essentially these are all advanced metrics adjusted for things like tempo and strength of opponent. A more detailed explanation + leaderboard can be found right here on Football Outsiders.
ESPN FPI - ESPN’s Football Power Index, which also an opponent adjusted metric.
Raw Advanced Metrics- Expected Points Added, Success Rate, Explosive Play Rate on both offense and defense. These are not opponent adjusted, so it is a more raw measure of what a team did on the field.
Wins Above Expectation - This is actual wins vs. how many you games you were expected to win via post game win probability. The sweet spot for wins above expectation is just above 0. Too high and you probably had a little bit of luck on your side. If you finished in the negatives… probably left some meat on the bone.
Power 5 Tiers
These clusters are what we end up with after all is said and done. The clusters are ordered by their group’s average F+ rating (teams are ordered by alphabetical order within their group, so nothing to observe there). Doing a quick glance over I think the clustering algorithm did a solid job grouping the power 5. It is interesting it grouped the entire SEC together aside from the heavy hitters in the conference.
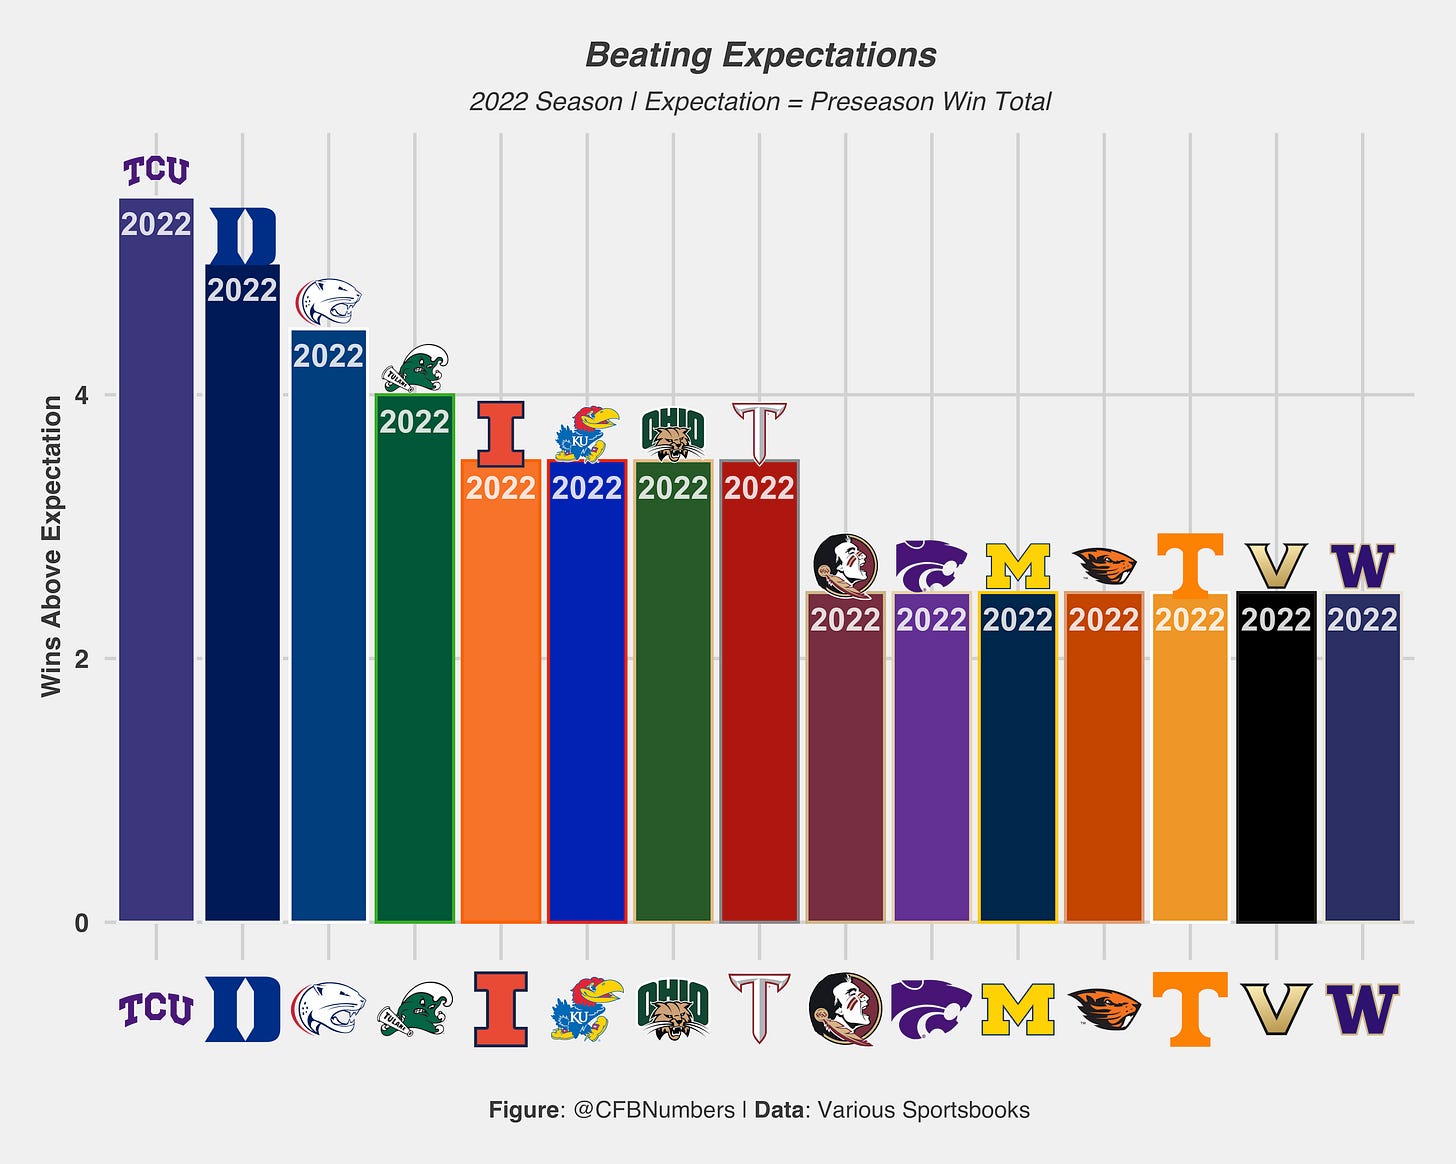
TCU is obviously one of the “biggest winners” of 2022 (even with the title game blowout). The reason they fall to the next tier in this is more to do with their standings in advanced/raw metrics vs. teams like Georgia or Ohio State. In terms of wins above expectation, TCU ranked 1st in the power 5. Can you claim they got lucky? Sure! But in the end they still won the games and made it to the final game of the season. This wasn’t included in the clustering, but no team beat their expectations more than TCU did in 2022:
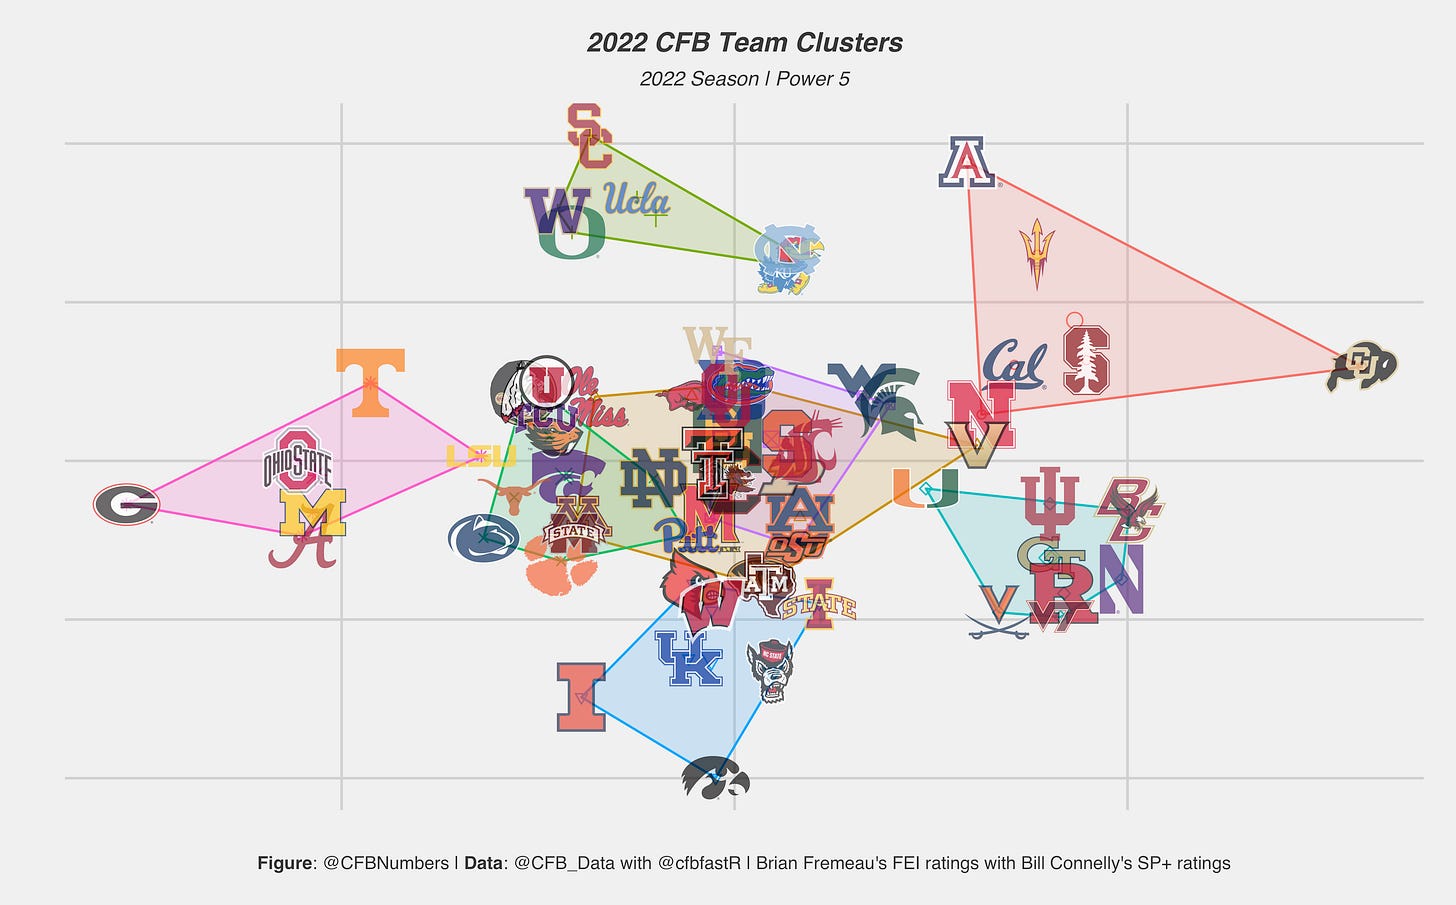
Now, before you punt your device into the sun, just because one team is on a higher tier than another doesn’t mean they’re 100% the better team. We can view the clusters a different way, using a technique called principle component analysis. Basically, we take all the variables and squish them into two new variables, or dimensions. This makes it easier to see how just close/far teams are from another.
In this view, you can clearly see a divide between national champion Georgia and the Colorado fighting Deions. Beyond that, it be a little jammed in the middle. With our groups in place we can average out the variables used among the groups in order to get a better idea of the makeup of the group. This is what we ending getting with some select variables:
Tier one almost sweeps the board in most categories. In terms of advanced metrics these were the very best teams in the game. Tiers 3/4 were almost exact opposites, with tier 3 teams (Kansas/UNC/USC etc.) boasting elite offenses but defenses that struggled, while tier 4 teams (Illinois, Iowa, Wisconsin etc.) had elite defenses but struggling offenses. This table also gives you an idea of how close tiers are to one another, with tiers 4-5 being separated by the smallest of amounts in some categories.
Best Offenses/Defense Based On Expectation
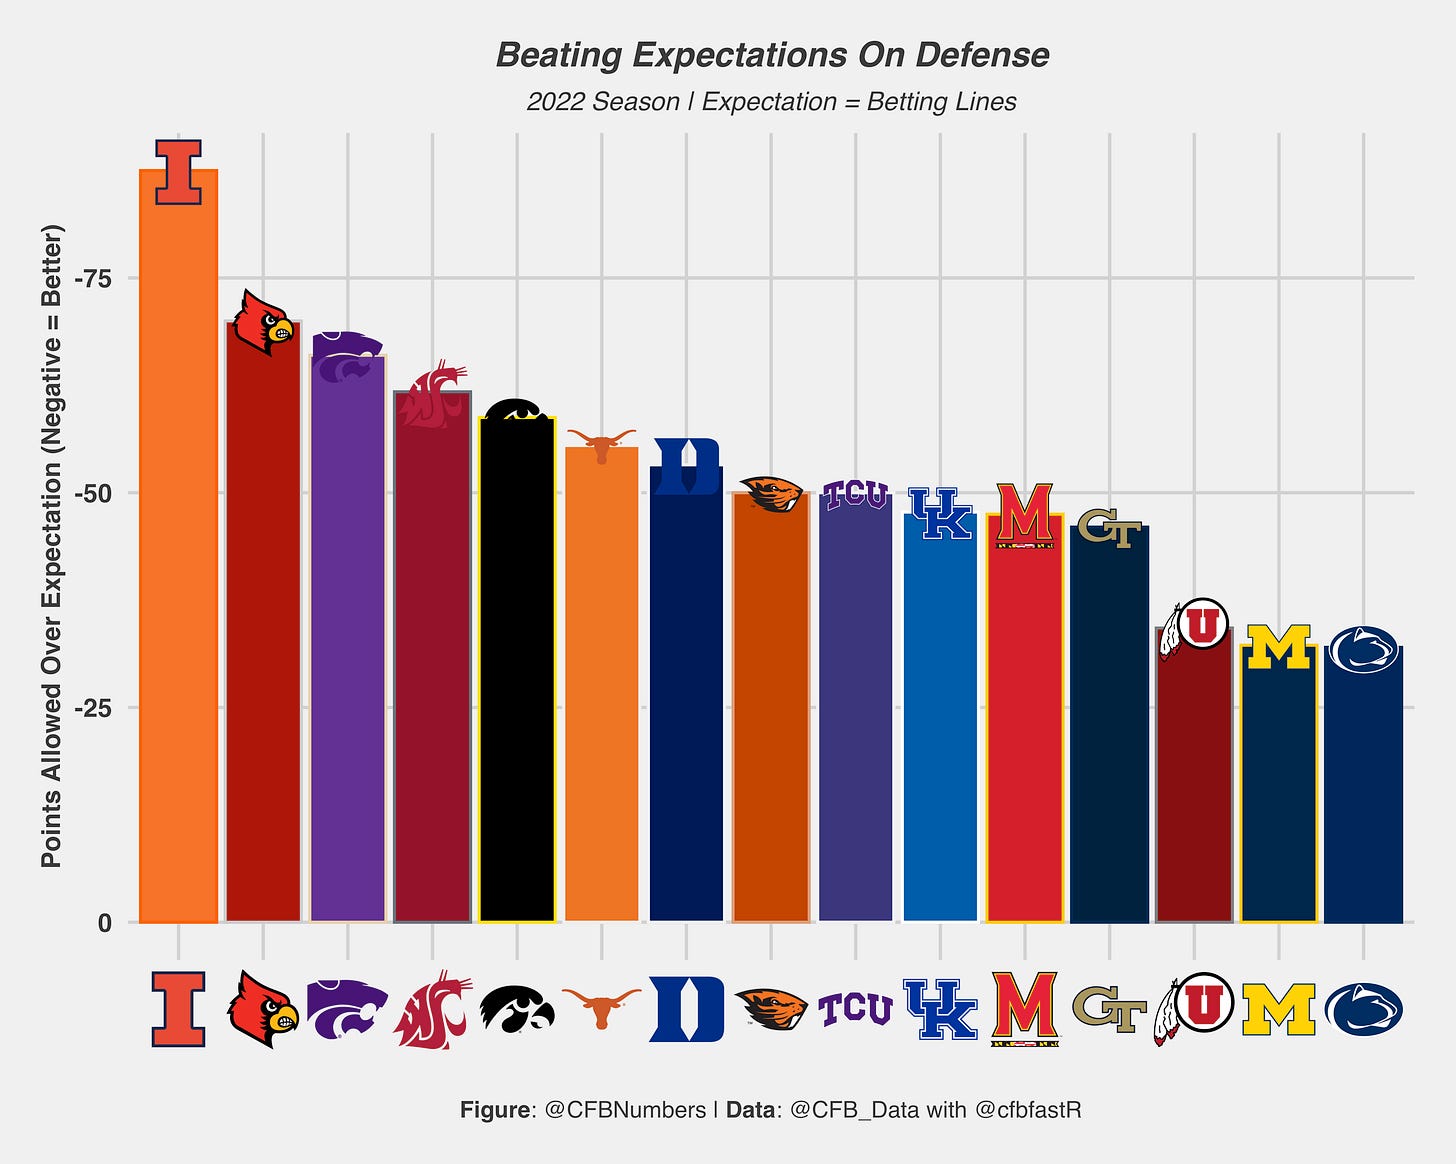
One final way we can see how teams did is by measuring their points scored or allowed vs. what betting lines expected them to do. First, let’s look at which offenses scored more points than they were expected to score.
The Tennessee offense was always expected to have some high powered moments given the nature of the Josh Heupel vertical passing offense, but I don’t think anyone expected them to be this consistently good this quick. Their offense propelled them into one of the more memorable Volunteer seasons in recent memory, and why they find themselves in the top tier of our clustered groups. Kansas football was, for the first time since 2008, competitive and super fun. Lance Leipold engineered one of the best stories of the season through his innovative option+ offense that is one of the most fun things to watch when everything goes according to plan. Like Coastal Carolina - Western Kentucky on the Group of 5 side, Tennessee/Kansas once again show there are many different offensive schemes and styles that can lead to some fun and efficient offenses in college football.
Here were the top performing defenses relative to expectation. Ryan Walters was named head coach at Purdue due to his work with the Illinois Defense, turning them into one of the best defenses in the country. Iowa made headlines all year for both their punishing defense, and their nepotism fueled inept offense. Finally, we have Duke football. Expectations were pretty low given the program and it was HC Mike Elko’s first year. Through the power of defense, Elko finished his first year with 9(!) wins, most in one year for Duke since 2014. You’ll also notice TCU made both the offense and defense lists. When it comes to expectations, TCU shattered them all.
QB Clustering
To wrap it up, let’s do one more clustering, but this time with the most important position in the game. QB’s can make or break programs, and provide endless amounts of storylines throughout the year. Here are the variables used for this round of clustering:
Raw Advanced Metrics: EPA/Play (Pass and rush), Success Rate, Explosive Play Rate. Like the team clusters, this is a raw estimate of their per play efficiency with no adjustments made.
PFF Grades + charted stats: PFF Offense + Pass + Rush Grades, Big time throw rate, turnover worthy play rate, accuracy rate, average depth of target, average time to throw, pressure to sack rate. These are mainly film based metrics that give us the tape perspective on these QB’s. The last three give us a little look into how they play, and if they avoid taking sacks under pressure.
ESPN QBR: THIS IS NOT PASSER RATING. Think Expected Points Added or per play efficiency + adjustments for strength of opponent.
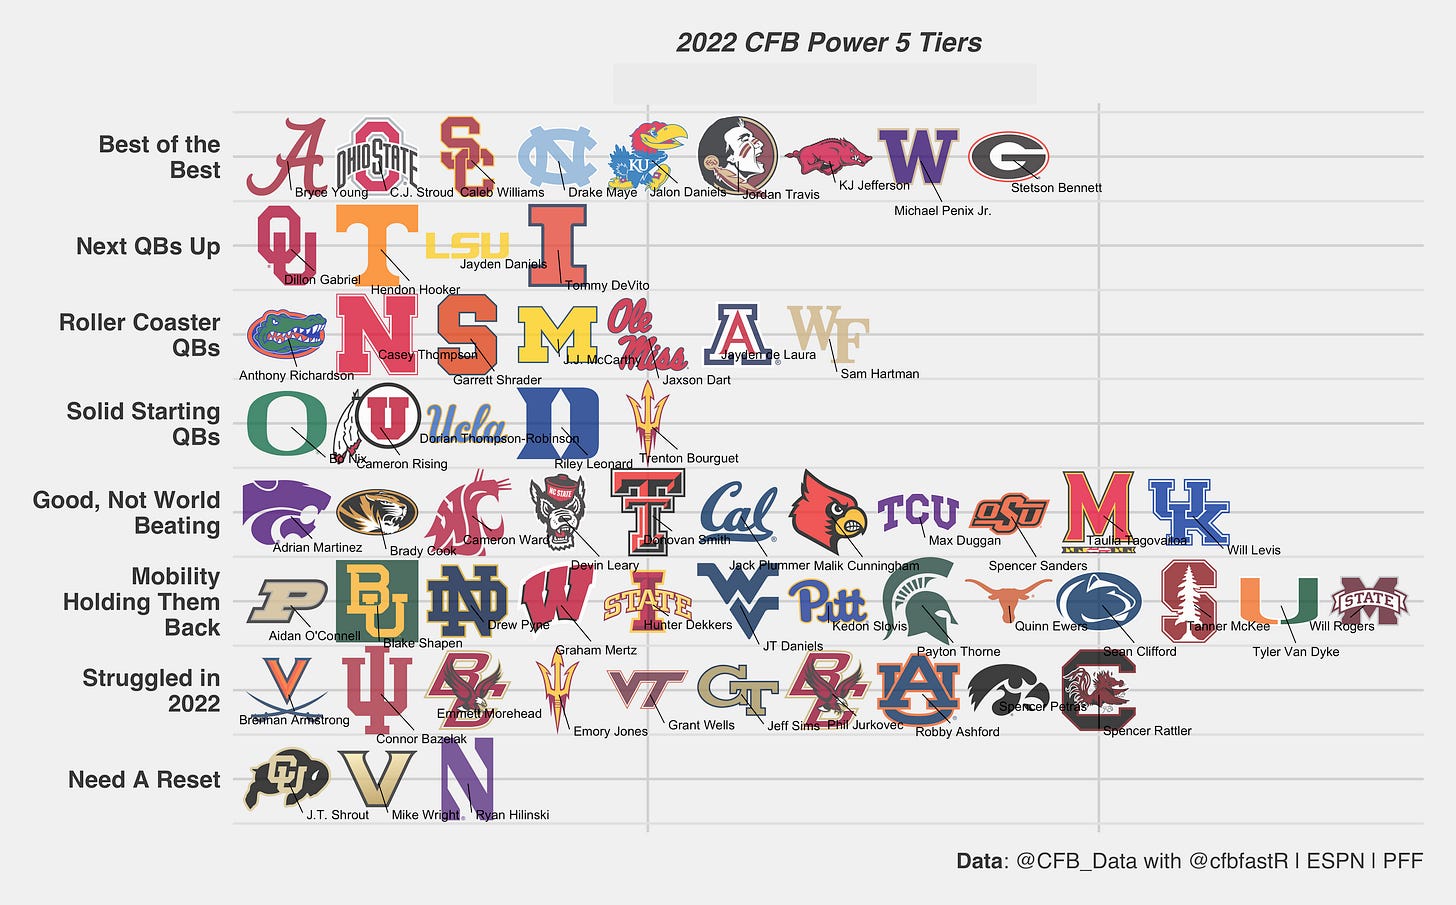
Factoring all of that it in, this is the final product. Similar to the team clusters, these are ordered by average PFF Offense Grade, and tiers in the mild can be seen as more fluid. This is easier to see when you look at it from a two dimensional perspective:
Oregon QB Bo Nix was one that I was curious on his placing. From what I can see, he was knocked by a low Big Time Throw %, and one of the lowest average depth’s of target in the entire Power 5 (59th/63 QB’s). Overall, he was still a highly efficient QB and one of the best returning QB’s next year. Joining him in that list of notable returning QB’s: Caleb Williams, Jordan Travis, Jalon Daniels, Drake Maye, KJ Jefferson and Michael Penix. If you love elite college QB play, next year is going to give you all that you could want and then some.
This is how each group stacked up in some of the variables used. The “Roller Coaster QB” tier stands out with their high Big Time Throw rate + high turnover worthy play rate. Headlining the “Good, but not World Beating” tier is Kentucky QB Will Levis, who is widely expected to be a first round draft pick this April. Simply put, his final season did not go as planned, finishing in the middle of the pack in most categories and 59/63 in Big Time Throw rate. Finally, we have Brennan Armstrong as the leader of the “struggled in 2022” group. Last season, Armstrong finished 23rd in QBR and look poised to have a strong season under new HC Tony Elliot. Unfortunately, the new offense went through some growing pains, leading to a disappointing season for Armstrong. Expect a bounce back from Armstrong after leaving for NC State for a fresh change of scenery.
That was a review of the Power 5 using the power of clustering! Next week, will tackle the Group of 5 to complete the FBS review.
If you want to dive in to the data like I do, check out @CFB_Data and @cfbfastR on Twitter, where you can learn how to get started in the world of College Football data analysis!
If you want to see more charts and one off analysis, follow my twitter page, @CFBNumbers


