One of the reasons conventional stats are more accepted in the football world is the ability to conceptualize these numbers. For example, when I say the QB threw for 400 yards, you can easily picture how far 400 yards is, and realize that is a lot of passing yards! The same goes with something like completion percentage. We know 50% is half so anything over and they completed more passes than they didn’t, which sounds good in my mind!
Looking at something like 0.05 EPA/Play… you can’t really conceptualize it. Even if you’re familiar with how Expected Points work, it can be hard to look at a box score and understand if 0.20 EPA/Play is good and how much better is it than 0.10 EPA/Play. My game recaps will have expected points numbers for the majority of the stats found on the boxscore. So, I figured giving you a little handy cheat sheet will help you better understand what you’re looking at.
To do this, I took every offense from every game in the CFP Era (2014-2020) and used their EPA/Play to transform the decimal into something more digestible: percentiles!
-0.148 EPA/Play - 25th Percentile
0.009 EPA/Play - 50th Percentile
0.156 EPA/Play - 75th Percentile
Here is how team EPA/Play shakes out. As you can see the median (50th percentile) EPA/Play is basically at 0. Positive equals good and negative equals bad wasn’t an issue before with conceptualizing EPA/Play, but now we can see just bad “bad” is. If your offense finished with an EPA/Play below -0.150… that probably will not be a game you watch on YouTube in the offseason. On the other hand if your offense is dominating, you’d expect to see their EPA/Play hovering around the 0.16+ range.
Anything past 0.3 EPA/Play and you start to get into some silly season games. The games that look like basketball scores on the ESPN ticker. Team EPA/play numbers are much tighter compared to individual EPA/Play numbers, with a range of around -0.5 to 0.5, with a couple outliers in both directions.
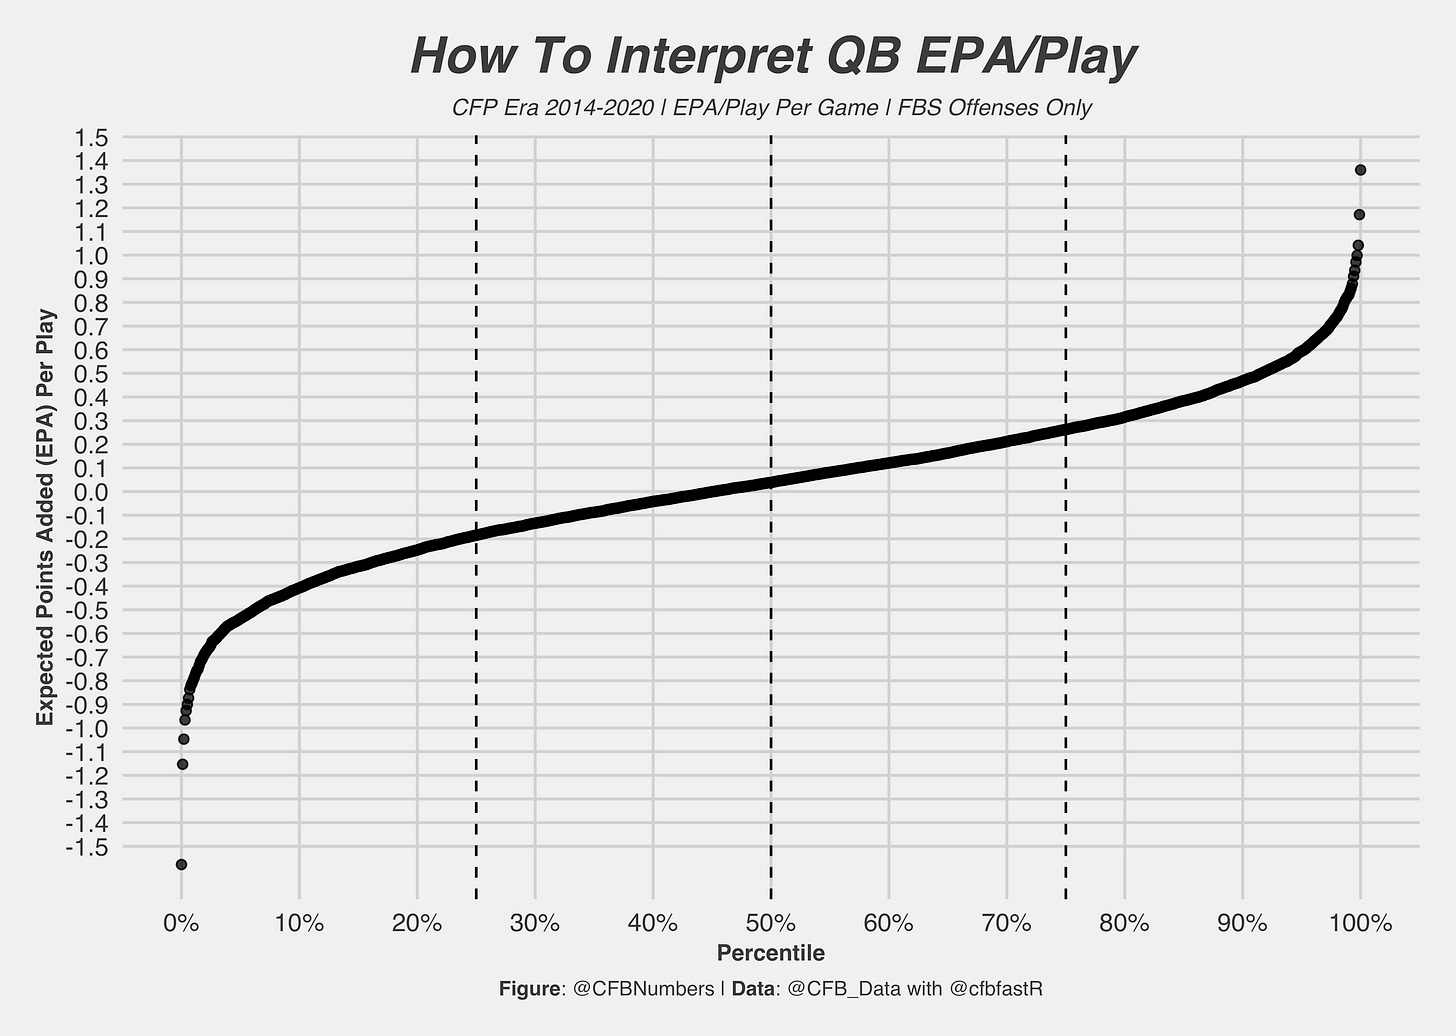
-0.185 EPA/Play - 25th percentile
0.039 EPA/Play - 50th Percentile
0.262 EPA/Play - 75th Percentile
Speaking of individual EPA/Play numbers, here is what it looks like for the QB’s. As you can see, the range is much wider compared to team numbers, with performances ranging from around -1 EPA/Play all the way up to 1. The same “positive equals good” applies to QB’s, but higher/lower end performances are a bit bigger than team play. Anything higher than 0.262 EPA/Play and you’re most likely REALLY excited about your staring QB. Anything lower than around a -0.20… the backup QB becomes a very popular person.
Another trick you can do with EPA/Play is look at it through Total EPA (EPA/Play * Plays). For example, if a QB struggled and finished at -0.18 EPA/Play over the span of 40 plays, that comes about to -7.2 Total EPA. If his team lost by a touchdown… lord help that man in the message boards. That is an inexact science and we obviously can’t tell if the QB was solely at fault, but its an easier way to picture it in your head. 24 expected points sounds like a lot of points! -7 on the other hand… not good.
There you have it folks! An easier way to digest EPA/Play. You may be wondering “What about defense? or RBs?” Well, defensive EPA/Play is just what the offense did flipped. So negative is your friend defensively. For RB’s and WR’s, I didn’t include them because they aren’t the biggest drivers of their production. For RB’s, it is too hard to separate the OL run blocking from the RB rushing production. The same goes for WR’s and their QB’s.
I hope his helps you with conceptualizing EPA/Play. If you ever have any more questions on EPA or any other advanced metric, my email and Twitter DM’s are always open! Hope you all enjoy the start of the college football season!!!
If you want to dive in to the data like I do, check out @CFB_Data and @cfbfastR on Twitter, where you can learn how to get started in the world of College Football data analysis!
If you want to see more charts and one off analysis, follow my twitter page, @CFBNumbers


