When Sports Collide: The College Football Premier League
Using numbers to bring the English Premier League to College Football
I was reading a brilliant article by Chris Vannini of The Athletic, where he interviewed European soccer writers to show the similarities between College Football and the English Premier League (EPL). If you want to read it for yourself, you can find the article here.
When you think of a sport that is the most similar to college football, your first thought is almost always the NFL. The more you think about it, the connections with the EPL fit the wacky world of college football to a T. There are only a handful of teams that have a realistic change to contend for the national championship (Think the Alabama’s and Ohio States). The rest are looking for everything to click one magical season leading to new program heights like a New Year’s Six Bowl (The EPL example is analytics driven Brighton qualifying for the Europa League for the first time ever this past season).
Some programs are more financially committed than others, leading to wider gaps in talent disparity. With the addition of the transfer portal, it may be harder for lower level programs to keep the diamonds in the rough they uncover while recruiting. Still, despite all of the inequality, fans are as passionate as ever about their team even if their odds of winning a national championship are 0.
This article got me thinking two things: 1. Which college football programs resemble certain EPL teams? and 2. What would a Premier league like season look like in college football? Looks like we got ourselves a project on your hands.
CFB/EPL Clustering
To answer question one, we turn to our good ole fashion clustering algorithm. For those unfamiliar, clustering is the most used tool in this newsletters toolbox. Most recently, we clustered the 2023 NFL Draft QBs. Essentially it is an easy way to take a bunch of variables and group teams together by their similarities. Now, normally we use a method called “K-Means” clustering, where cluster centers are the average of the clusters points. This time, we will use a method called “K-Medoids”, where the center of a cluster is actually a data point (in this case, a team).
The idea here is we can chose the EPL teams as our centers, and then see which CFB teams fall into their clusters. Think of it like a local caucus. The EPL teams are the candidates, and the CFB teams are the voters that will break off and stand next to whichever EPL team that closely resembles their profile.
For the CFB teams, we will be sticking to the power 5 teams. For the EPL, we will be using the 12 teams that have only 300 matches played since the 2013-2014 season. This includes the “Big six”, or for those who don’t follow soccer, the powerhouses of the EPL (Arsenal, Manchester City, Manchester United, Liverpool, Chelsea, Tottenham), and six other teams that more often than not hang around the middle to bottom of the pack (Leicester City, Newcastle United, Everton, West Ham United, Crystal Palace FC, Southhampton FC).
In order to get groups we need variables to input into the algorithm. Obviously the metrics/scoring in football and soccer are drastically different, so each metric has been scaled within its specific sport. Here is what we’re working with:
Average Offense - For college football, we’re using points scored per season since the 2013 season. For the EPL teams, we’re using goals scored per season since the 2013-2014 season. This represents 10 seasons worth of data for each league.
Average Defense - CFB: Points allowed per season. EPL: Goals Allowed per season.
Average Net - Point (CFB) or Goal (EPL) differential per season.
Average Win Pct
Average Rank - For CFB, this is a teams season average rank in their respective conferences based on win percentage. For the EPL, this is their average season rank in the table.
Clustering Results
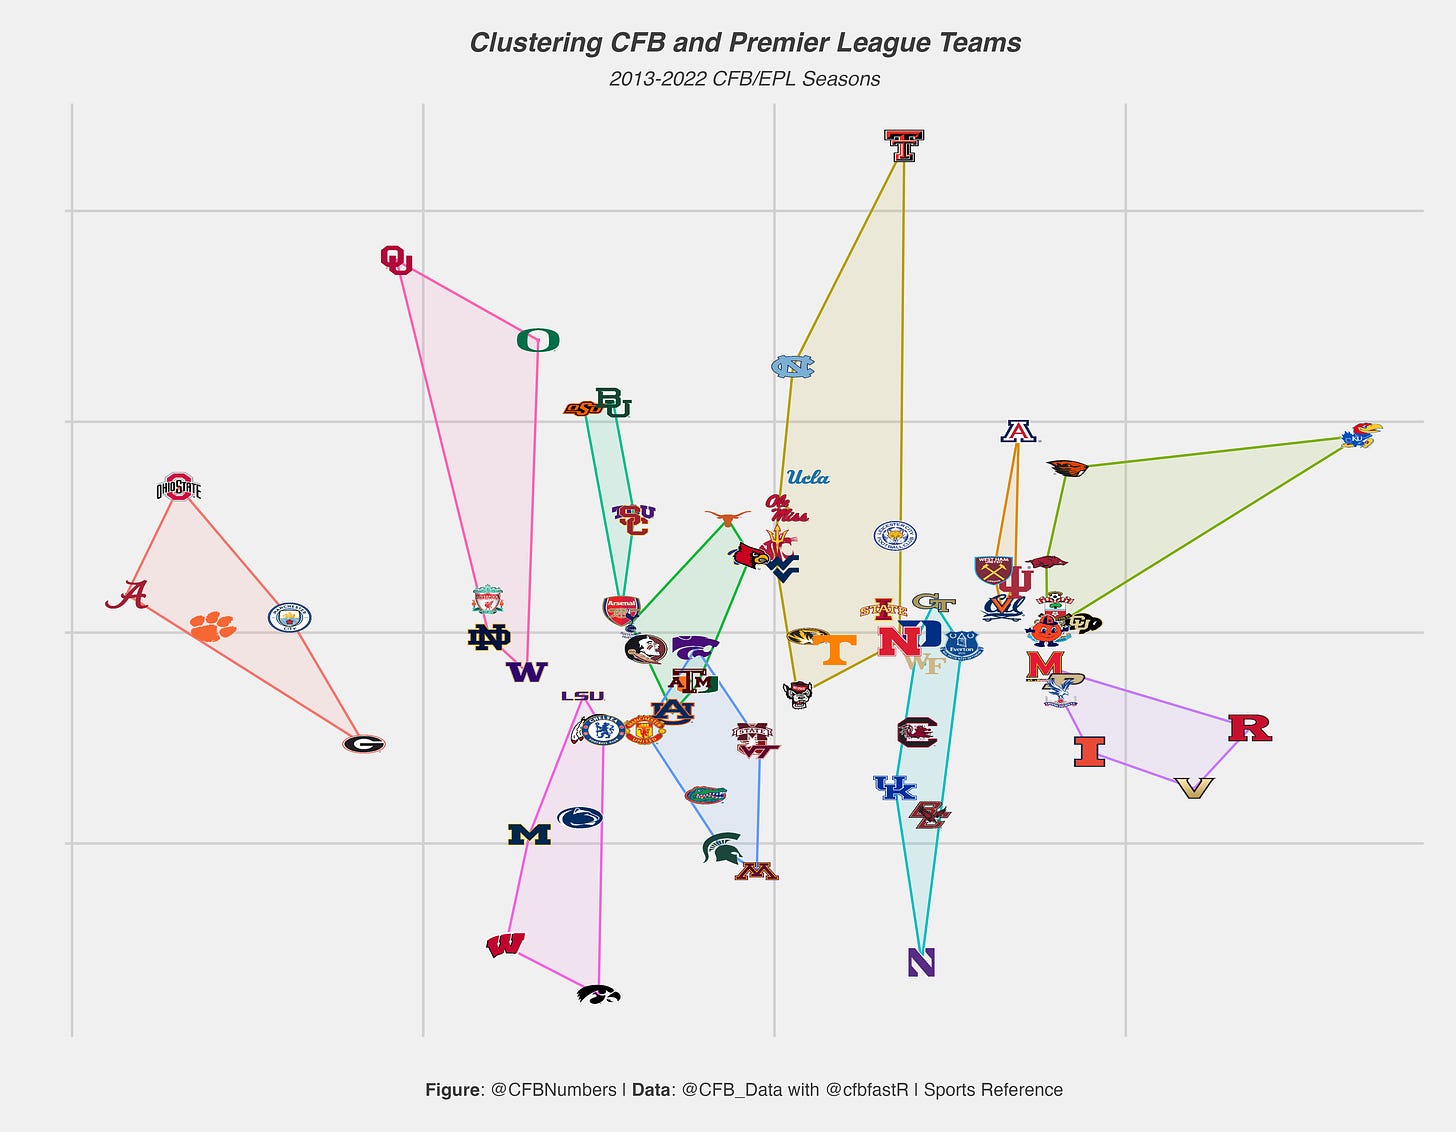
Here are the results of our clustering. At the top we have the Manchester City cluster, which represents the powerhouses of CFB during the CFB Playoff era. Manchester City has been dominant as of recently in the EPL, winning 5 of the last 6 Premier League championships. The only other team to win the EPL in that time is Liverpool, which comes in as our next cluster. While none of the CFB teams in this cluster can claim a title since 2013, they’ve have all hung around near the top of the CFB world, and have each been to the CFB Playoff.
Admittedly I am a very casual observer of the EPL, so my knowledge of teams are not that extensive. However, I do know that Tottenham is known for their… lets call it optimistic to a fault type fans (delusional is a word I hear often). While I would never use the D word, I can say I have heard that thrown around with teams like Texas A&M, Texas, Auburn, Miami and unfortunately my Noles.
Leicester City took the soccer world by storm when they won the Premier League in 2015-2016. At 5,000-1 odds to win before the season, it was one of the biggest underdog stories in sports history. While the teams in this cluster haven’t come close to a story like that, there are some David beating Goliath stories in this cluster. Whether its NC State beating Clemson in OT in 2021, Tennessee out dueling Alabama in 2022, or Iowa State topping Oregon to claim the 2021 Fiesta Bowl, there are plenty of over achieving moments in this tier.
Final thing of note is Newcastle United. They’re attempting to disrupt the “Big 6” with their new backing by the Saudi Investment Fund (Which isn’t good but thats another article). For the first time in 20 years, they will play in the Champions league after finishing 4th in the 2022-2023 season. Money aside, the idea of being the “new face on the block” is very fitting for Colorado, who is attempting to return to the national stage with Deion Sanders.
Another way to visualize our clusters is to reduce our variables down to two variables (called principal component analysis) in order to plot each team/cluster on a XY scatter plot. To better understand why each team is where they are, we can plot the variables in order to see which direction a team gets pushed towards:
Winning and better standings in the rankings is pushing a team to the left of the graph. Teams that are more offense/attacking heavy are being pushed up on the graph, while defensive oriented teams are dropping to the bottom.
We have our clusters and they look to be in good order. Now that we have answered our first question, we can get to our last one: What would a Premier league like season look like in college football?
Simulating A CFB Premier League Season
In order to simulate a “premier league” type season, we need to create a schedule where each team plays every other team (In the EPL they play every team twice, but that would be a little too unrealistic for CFB, so we will settle for once). With 65 Power 5 teams, it also wouldn’t be quite realistic to have every team play each other. With that in mind, we will instead keep teams to conference play only (Notre Dame is put in the Pac-12 for numbers purposes).
To simulate a season, we obtain win probabilities for each team in each matchup, and then simulate the matchup to see who wins. Score differential for each match was also simulated. With every matchup simulated, we can get win percentages on the season and rank teams based on those percentages. A teams season long score differential was used to handle ties. This is what a simulated season looks like:
Each team played 13 games, with the top 3 teams advancing to the CFB Champions League (Think the best teams of each conference playing the best from other conferences). The 4th/5th place teams play each other for a spot in the Champions League (In the EPL this would be the Europa league, but figured this was our twist). The bottom two teams, in this case Miami and Boston College, get relegated to a group of 5 conference.
For this particular simulation, each teams 2022 ELO ratings were used to simulate the matchups. However, for our 1000 season simulations, we will be using a teams average ELO rating during the CFB Playoff era. With that being said, let’s simulate 1000 seasons to see how a typical season would operate.
ACC Simulations
Clemson has dominated the ACC in the playoff era, so it is no surprise they dominate our ACC Premier league simulations. Outside of Clemson, there seems to be a little bit of parity when it comes to Champions League spots. We even have some chaos seasons where teams like NC State and Wake Forest take the league by storm and claim the title. Towards the bottom of the table, we see Syracuse getting relegated more than half of the time. In terms of hierarchy in the ACC, this seems good.
SEC Simulations
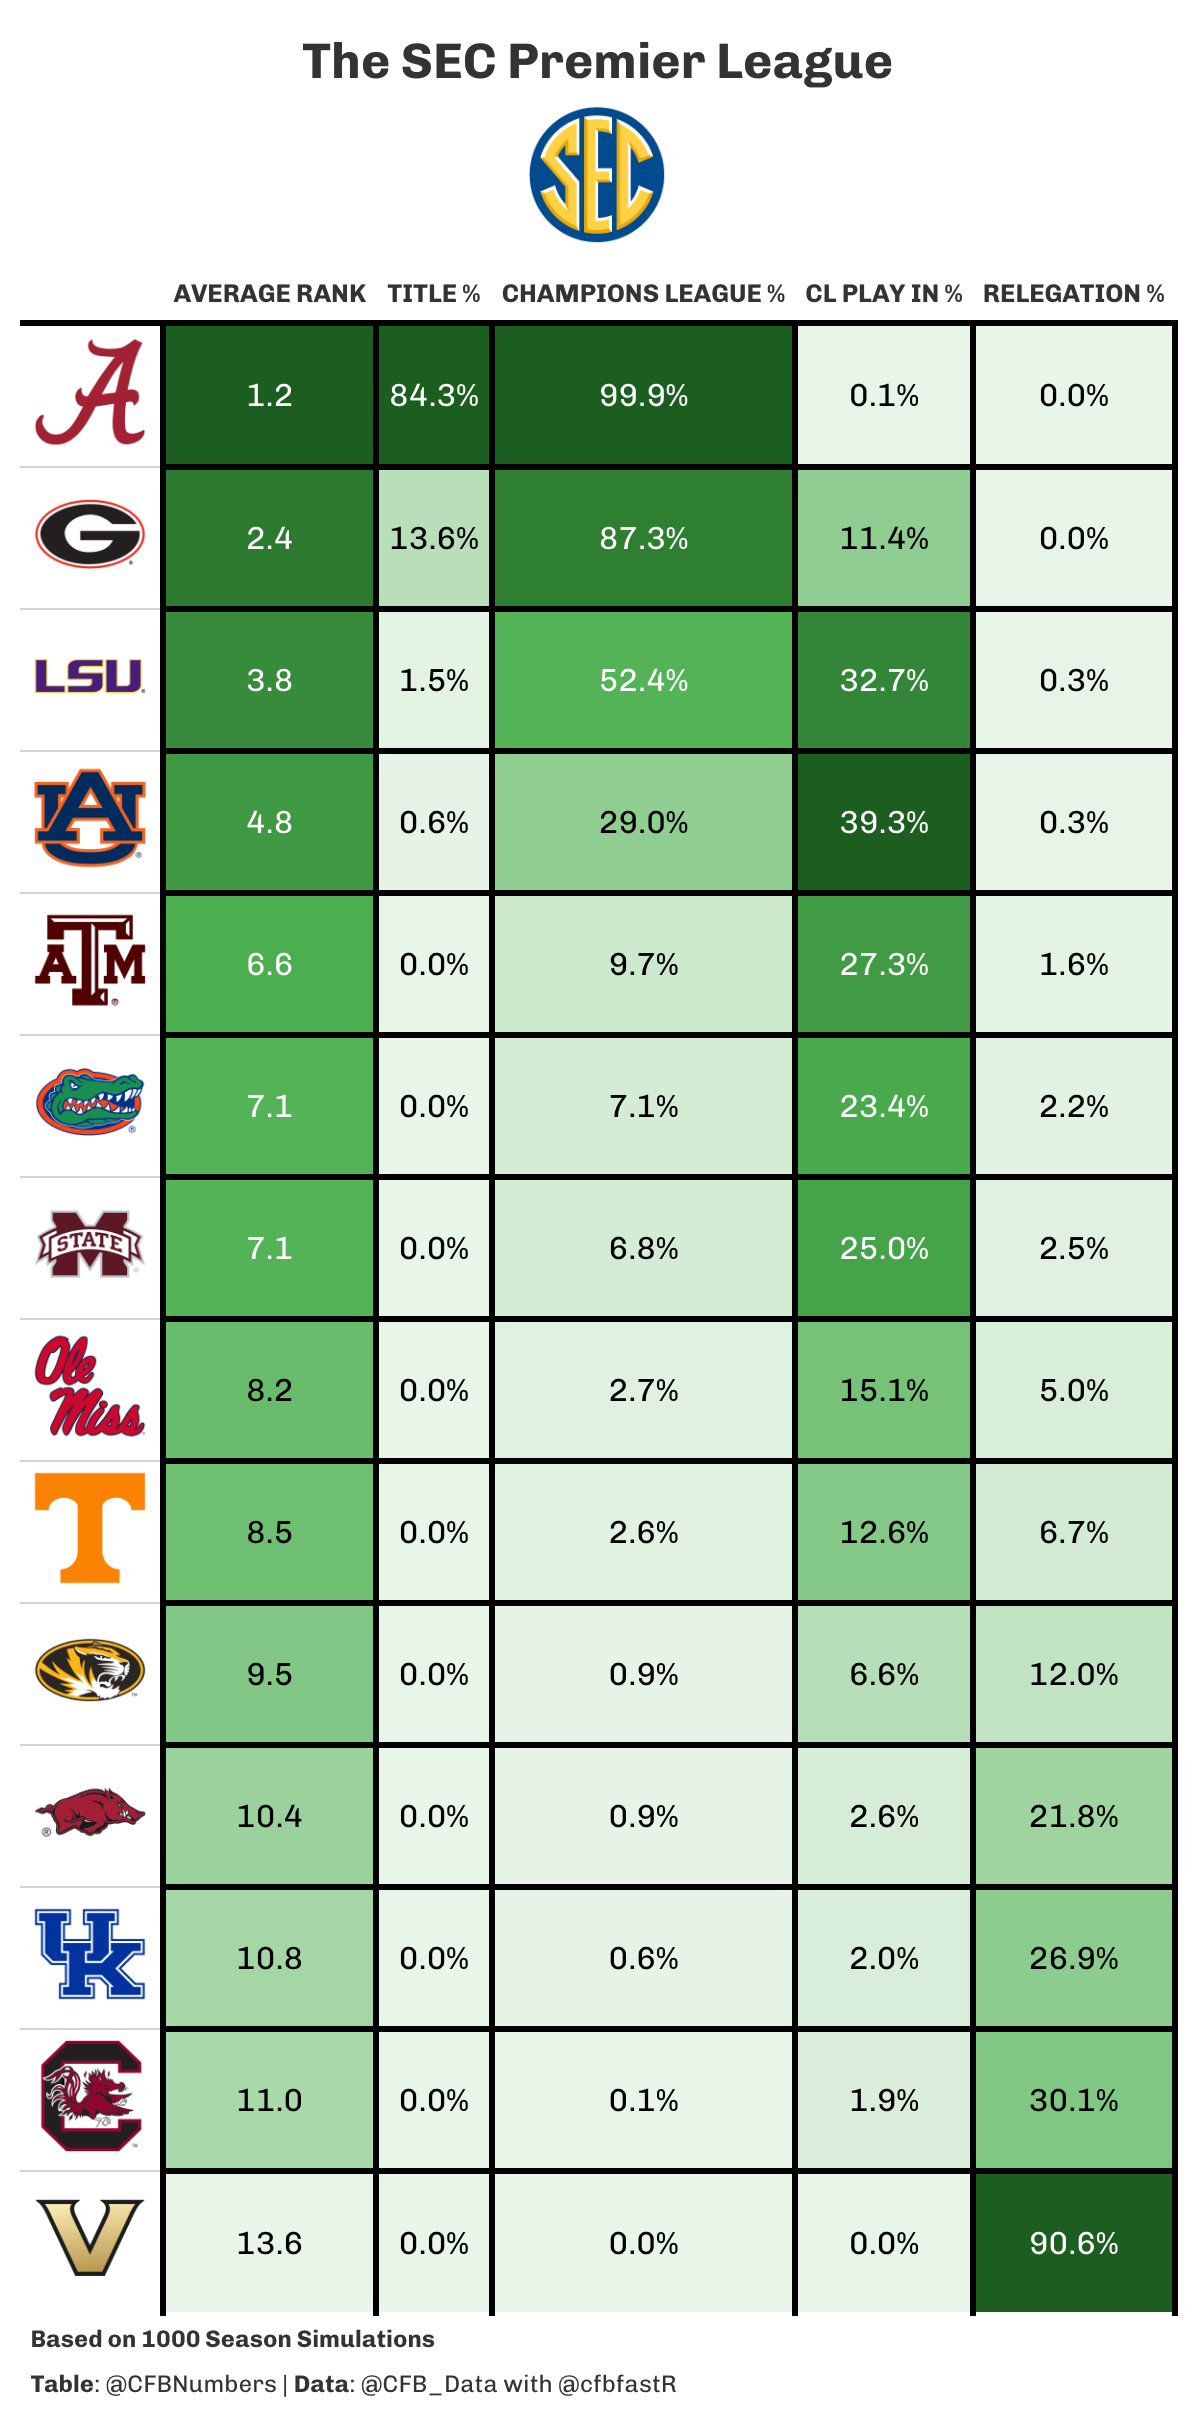
The power dynamic has shifted to Georgia over Alabama as of late, but in terms of the entire playoff era the SEC has been Alabama’s conference. In comparison to the ACC, there is a bit more parity at the top with Alabama and Georgia leading the way in titles, followed by LSU. Relegation is a concept that will probably never be introduced into a league that doesn’t already have it (no owner/AD/etc. would vote for potentially relegating their team in the future), but the messages boards when a SEC team got relegated would be a sight to see.
Big Ten Simulations
While Ohio State has dominated the Big Ten, there were seasons that other teams hoisted the B1G Premier trophy. Rivalries are an important part of both CFB and the EPL, and the thought of a Ohio State Michigan matchup with the B1G Premier League title on the line sounds like the ultimate dream. At the bottom of the table, Rutgers gets the short end of the stick 82% of the time.
Big 12 Simulations
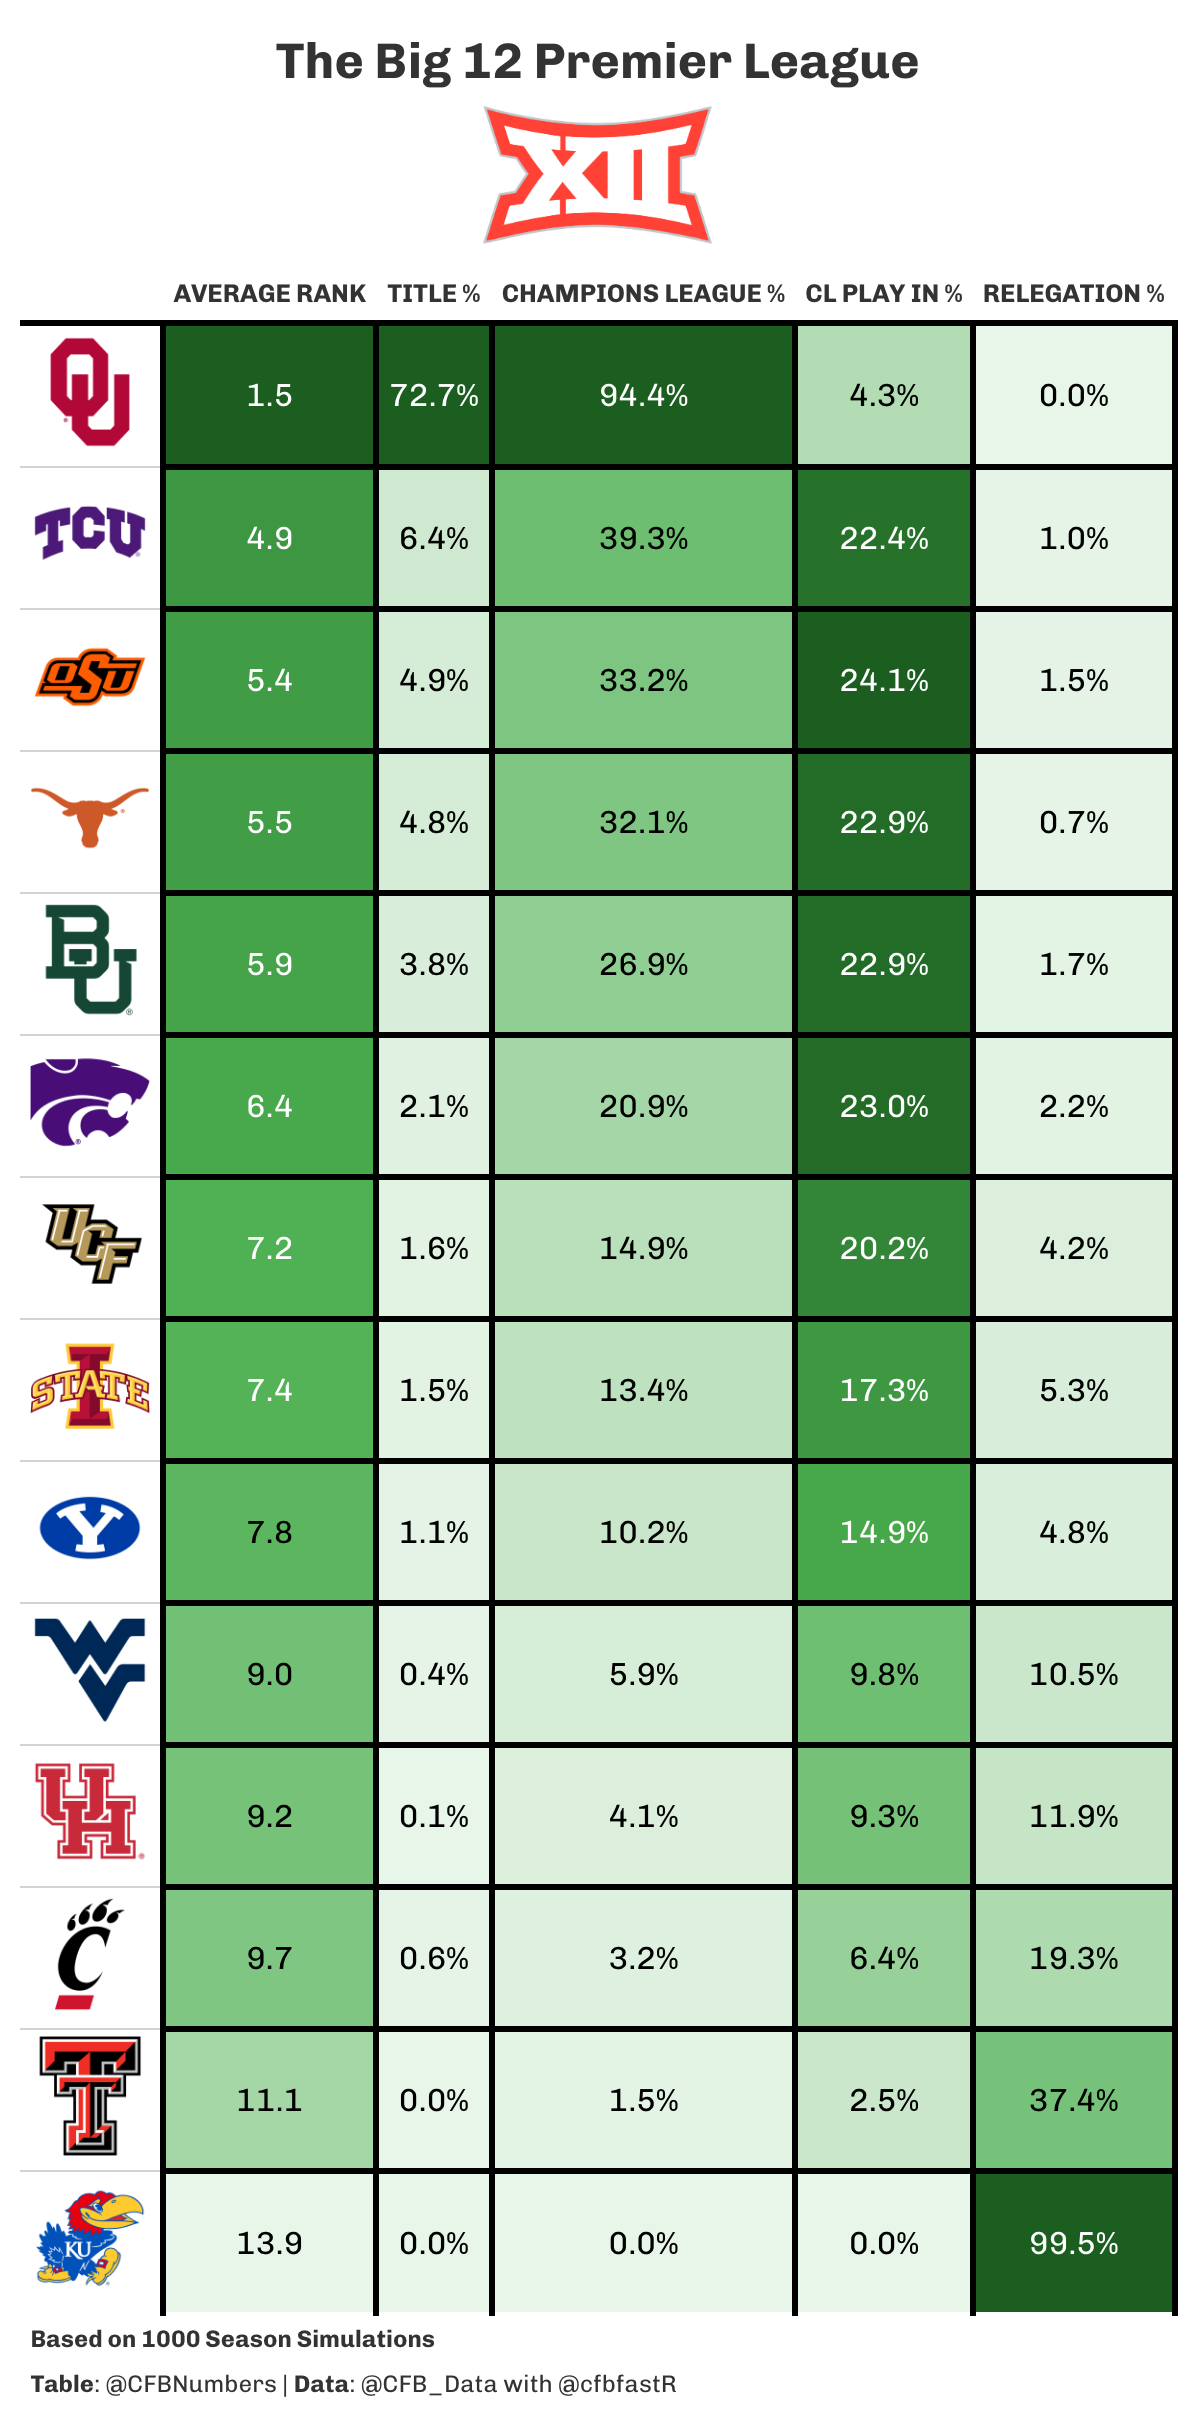
In order to make the simulation process easier and similar for every conference, the four new Big 12 teams (UCF, Houston, Cincinnati, BYU) join and bring the conference to 14 teams. At the top of the table, Oklahoma is our dominating team, though at only 72.7% there are plenty of seasons with different outcomes. While Kansas did take the nation by storm with their electric offense in 2022, they have had a woeful time in the playoff era and were near locks for relegation in our simulations.
Pac 12 Simulations
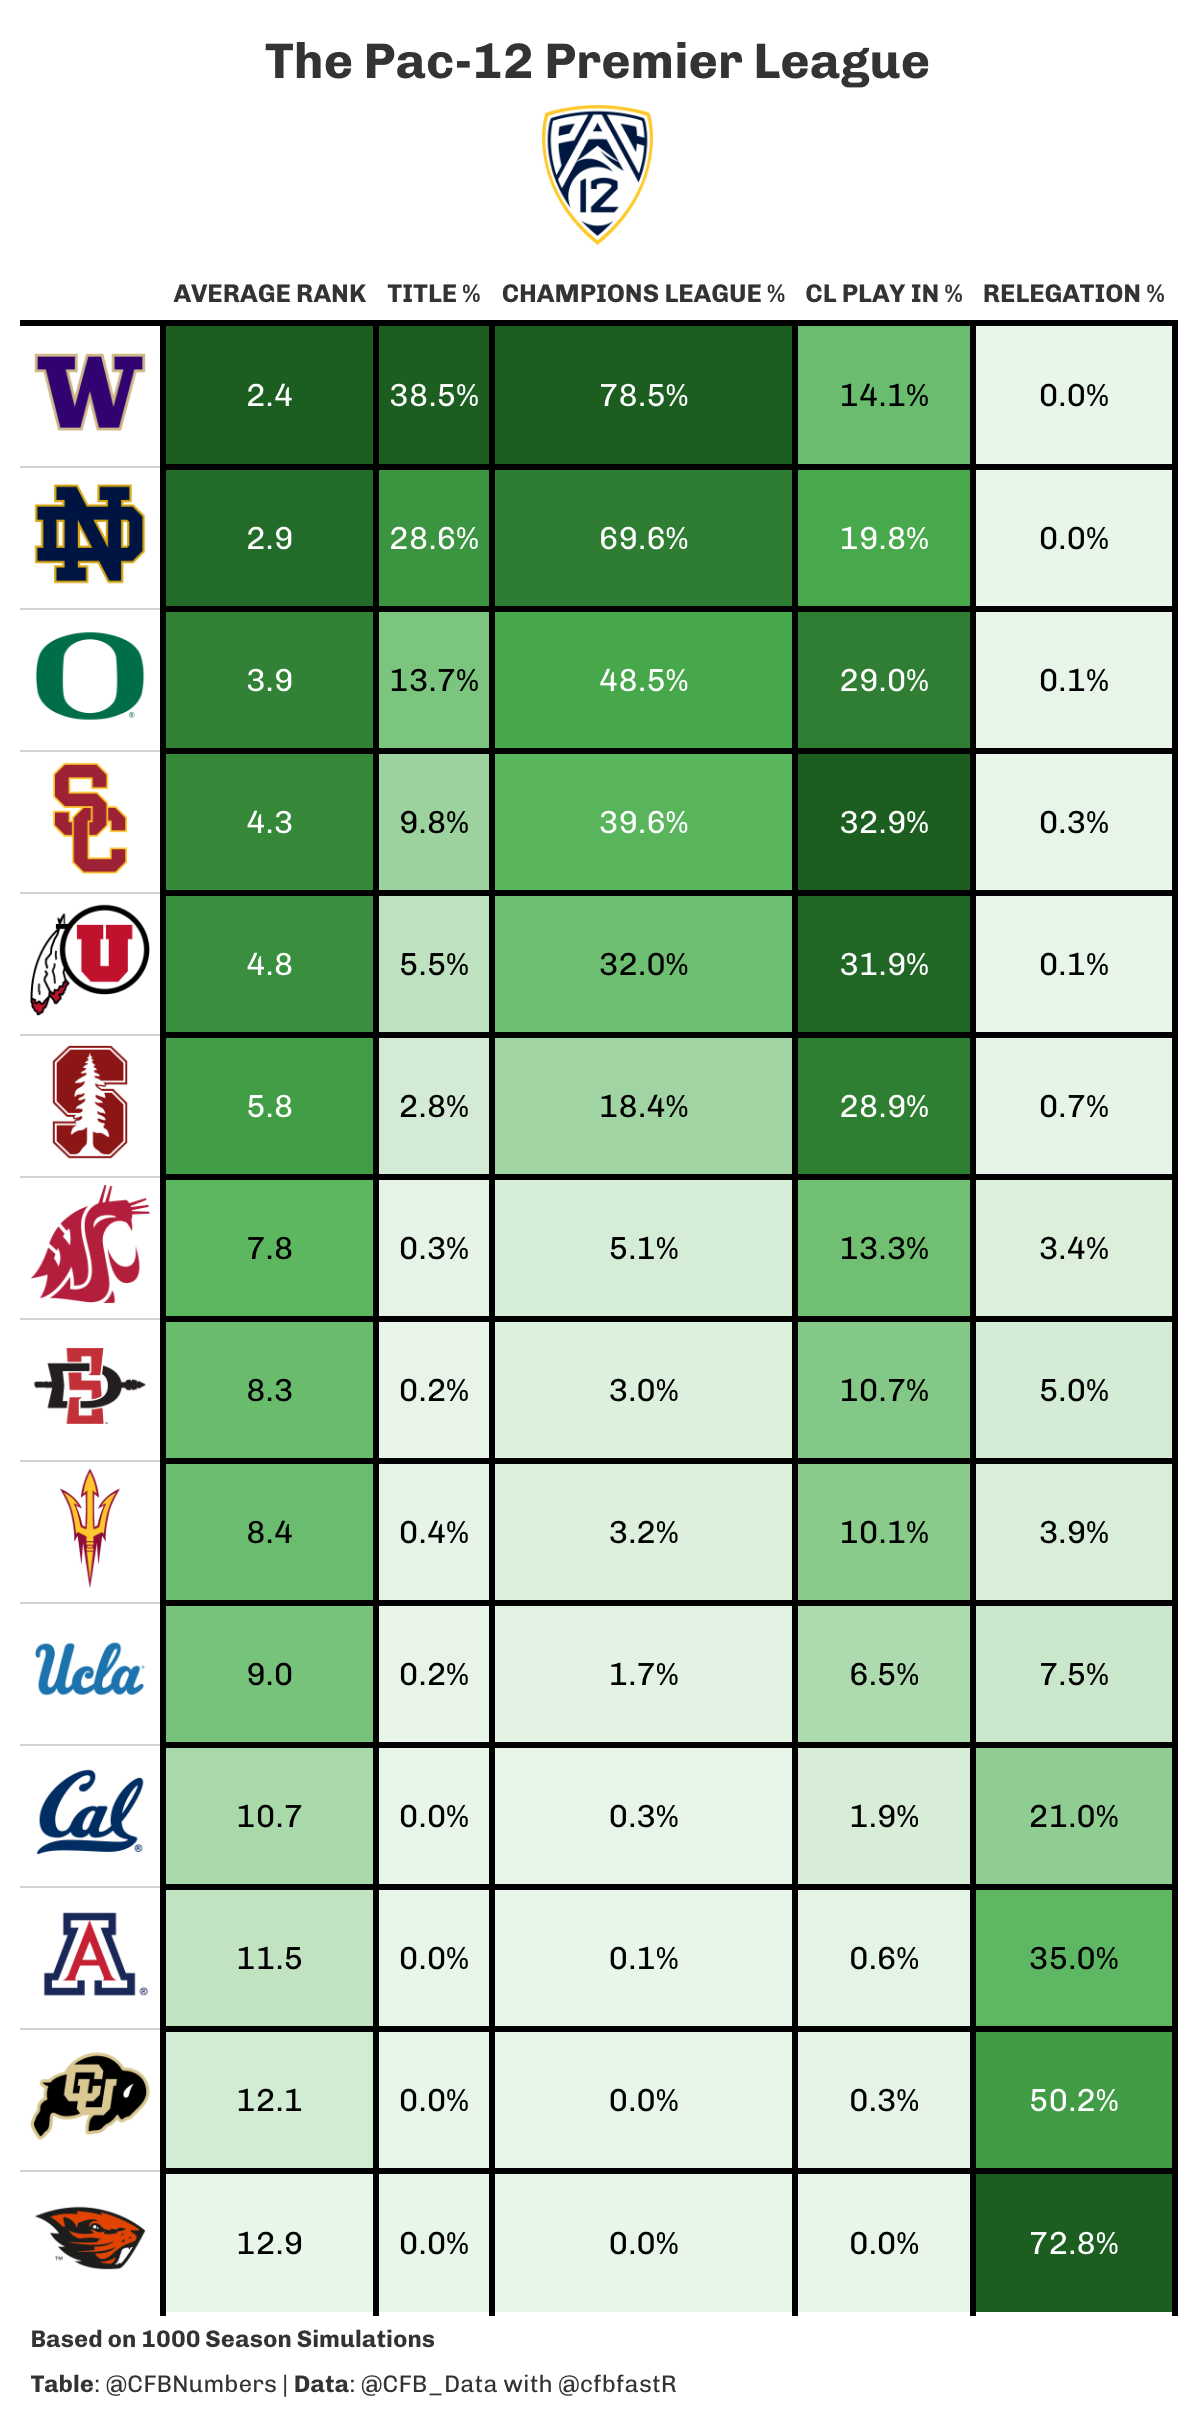
Finally we have the Pac-12 + Notre Dame. Out of our 5 conferences, the Pac-12 has the most parity by far. In a four team playoff world, this leads to the conference on the outside looking in more often than not. In a conference premier league world, this would lead to exciting matchups week in and out until the end. Notre Dame and USC with a chance to win the Pac-12 Premier League title sounds like a mouthwatering matchup. At the bottom of the table, Deion Sanders takes over a Colorado team that faces an immediate threat of relegation. Will his transfer heavy approach allow him to avoid a trip to a lower league?
College football and the English Premier League share many similarities. The passion of the fanbases regardless of power status in the league makes each league special in their own way. In these leagues, a “great” season can be a title for one team, or it could be beating down your rival and finishing high in the standings for another team. This project was meant to be a fun way to combine each league and look at what a “premier league” type season would look like in the world of college football. Hopefully you enjoyed this article, and maybe found yourself a Premier League team to root for this upcoming season!
Buy Me A Coffee!
https://www.buymeacoffee.com/CFBNumbers
As long as I do this newsletter I will keep it free so that as many people as possible can enjoy and join us on our CFB data adventure. However, if you did want to show additional support the newsletter (which you 100% do not have to!) you can always buy me a coffee here!
If you want to dive in to the data like I do, check out @CFB_Data and @cfbfastR on Twitter, where you can learn how to get started in the world of College Football data analysis!
If you want to see more charts and one off analysis, follow my twitter page, @CFBNumbers


